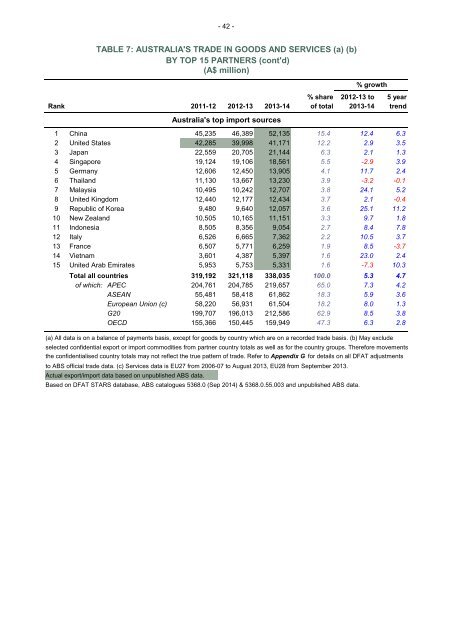
- 42 - TABLE 7: AUSTRALIA'S TRADE IN GOODS AND SERVICES (a) (b) BY TOP 15 PARTNERS (cont'd) (A$ million) % share 2012-13 to 5 year Rank 2011-12 2012-13 <strong>2013</strong>-<strong>14</strong> of total <strong>2013</strong>-<strong>14</strong> trend Australia's top import sources % growth 1 China 45,235 46,389 52,135 15.4 12.4 6.3 2 United States 42,285 39,998 41,171 12.2 2.9 3.5 3 Japan 22,559 20,705 21,<strong>14</strong>4 6.3 2.1 1.3 4 Singapore 19,124 19,106 18,561 5.5 -2.9 3.9 5 Germany 12,606 12,450 13,905 4.1 11.7 2.4 6 Thailand 11,130 13,667 13,230 3.9 -3.2 -0.1 7 Malaysia 10,495 10,242 12,707 3.8 24.1 5.2 8 United Kingdom 12,440 12,177 12,434 3.7 2.1 -0.4 9 Republic of Korea 9,480 9,640 12,057 3.6 25.1 11.2 10 New Zealand 10,505 10,165 11,151 3.3 9.7 1.8 11 Indonesia 8,505 8,356 9,054 2.7 8.4 7.8 12 Italy 6,526 6,665 7,362 2.2 10.5 3.7 13 France 6,507 5,771 6,259 1.9 8.5 -3.7 <strong>14</strong> Vietnam 3,601 4,387 5,397 1.6 23.0 2.4 15 United Arab Emirates 5,953 5,753 5,331 1.6 -7.3 10.3 Total all countries 319,192 321,118 338,035 100.0 5.3 4.7 of which: APEC 204,761 204,785 219,657 65.0 7.3 4.2 ASEAN 55,481 58,418 61,862 18.3 5.9 3.6 European Union (c) 58,220 56,931 61,504 18.2 8.0 1.3 G20 199,707 196,013 212,586 62.9 8.5 3.8 OECD 155,366 150,445 159,949 47.3 6.3 2.8 (a) All data is on a balance of payments basis, except for goods by country which are on a recorded trade basis. (b) May exclude selected confidential export or import commodities from partner country totals as well as for the country groups. Therefore movements the confidentialised country totals may not reflect the true pattern of trade. Refer to Appendix G for details on all DFAT adjustments to ABS official trade data. (c) Services data is EU27 from 2006-07 to August <strong>2013</strong>, EU28 from September <strong>2013</strong>. Actual export/import data based on unpublished ABS data. Based on DFAT STARS database, ABS catalogues 5368.0 (Sep 20<strong>14</strong>) & 5368.0.55.003 and unpublished ABS data.
- 43 - TABLE 8: AUSTRALIA'S TOTAL TRADE IN GOODS AND SERVICES (a) (b) BY SELECTED COUNTRIES AND REGIONS (A$ million) % growth % share 2012-13 to 5 year Selected countries 2011-12 2012-13 <strong>2013</strong>-<strong>14</strong> of total <strong>2013</strong>-<strong>14</strong> trend Argentina 1,097 1,075 1,138 0.2 5.9 6.9 Belgium & Luxembourg 3,743 3,302 3,246 0.5 -1.7 1.4 Brazil 2,529 1,851 2,174 0.3 17.5 -7.6 Brunei 1,497 1,161 892 0.1 -23.2 -3.4 Canada 5,433 5,555 5,264 0.8 -5.2 0.2 Chile 2,154 1,942 1,831 0.3 -5.8 7.0 China 128,206 131,116 159,712 23.9 21.8 13.8 Fiji 1,568 1,550 1,647 0.2 6.3 3.2 France 8,294 7,621 8,186 1.2 7.4 -3.6 Germany 15,837 15,609 16,825 2.5 7.8 1.9 Greece 559 559 681 0.1 21.8 2.6 Hong Kong (SAR of China) 7,646 7,830 8,296 1.2 6.0 1.0 India 18,717 17,005 <strong>14</strong>,768 2.2 -13.2 -7.7 Indonesia <strong>14</strong>,906 <strong>14</strong>,257 15,961 2.4 12.0 6.5 Ireland 3,682 3,311 3,266 0.5 -1.4 -2.2 Italy 8,041 7,813 8,563 1.3 9.6 1.6 Japan 75,907 69,391 72,173 10.8 4.0 1.0 Malaysia 17,161 17,050 19,945 3.0 17.0 6.4 Mexico 3,035 2,944 2,6<strong>14</strong> 0.4 -11.2 4.9 Netherlands 7,082 5,885 5,494 0.8 -6.7 -0.1 New Zealand 21,582 21,011 22,690 3.4 8.0 0.6 Norway 1,189 1,221 1,207 0.2 -1.2 4.1 Papua New Guinea 7,009 6,818 6,791 1.0 -0.4 5.1 Peru 385 398 351 0.1 -11.9 -1.8 Philippines 2,931 3,416 3,877 0.6 13.5 8.8 Republic of Korea 33,298 30,472 34,581 5.2 13.5 4.6 Russian Federation 2,215 1,733 2,396 0.4 38.3 10.5 Saudi Arabia 2,532 2,742 2,975 0.4 8.5 -1.0 Singapore 28,944 29,044 29,510 4.4 1.6 4.5 South Africa 3,496 3,136 3,035 0.5 -3.2 -6.0 Sweden 3,240 2,917 2,872 0.4 -1.5 -2.5 Switzerland 5,686 5,500 6,079 0.9 10.5 3.1 Taiwan 13,312 12,416 12,553 1.9 1.1 0.4 Thailand 17,659 19,422 18,836 2.8 -3.0 -0.5 Turkey 1,428 1,638 1,754 0.3 7.1 6.9 United Arab Emirates 8,605 8,536 8,663 1.3 1.5 4.5 United Kingdom 24,411 21,878 20,288 3.0 -7.3 -5.0 United States 57,578 54,833 58,202 8.7 6.1 2.5 Vietnam 6,544 7,<strong>14</strong>1 9,230 1.4 29.2 5.9 Country Groups (c) APEC 448,041 438,554 486,100 72.6 10.8 5.5 ASEAN 90,<strong>14</strong>8 92,121 98,987 <strong>14</strong>.8 7.5 4.3 European Union (d) 86,717 81,233 83,341 12.5 2.6 -0.8 G20 437,094 418,979 460,089 68.8 9.8 4.2 OECD 294,566 276,130 290,024 43.3 5.0 1.2 Geographic Regions (c) Africa 11,899 12,<strong>14</strong>5 11,021 1.6 -9.3 8.0 Americas 74,251 70,742 73,620 11.0 4.1 2.1 Asia 389,600 384,028 425,<strong>14</strong>1 63.5 10.7 5.6 Europe 98,174 92,249 95,557 <strong>14</strong>.3 3.6 -0.4 Oceania & Antarctica 32,238 31,300 33,346 5.0 6.5 1.6 Other (e) 30,318 33,057 30,533 4.6 -7.6 <strong>14</strong>.1 World 636,479 623,522 669,219 100.0 7.3 4.4 (a) All data is on a balance of payments basis, except for goods by country which are on a recorded trade basis. (b) May exclude selected confidential export/import commodities from partner country totals as well as for the country groups. Therefore movements in the confidentialised country totals may not reflect the true pattern of trade. Refer to Appendix G for details on all DFAT adjustments to ABS official trade data. (c) Refer to the Explanatory notes for country group definitions. (d) Services data is EU27 from 2006-07 to August <strong>2013</strong>, EU28 from September <strong>2013</strong>. (e) Includes unallocated and confidential trade. Based on ABS catalogues 5368.0 & 5368.0.55.003/4 and unpublished ABS data.