

cot-fy-2013-14
cot-fy-2013-14
cot-fy-2013-14

You also want an ePaper? Increase the reach of your titles
YUMPU automatically turns print PDFs into web optimized ePapers that Google loves.
- 7 -<br />
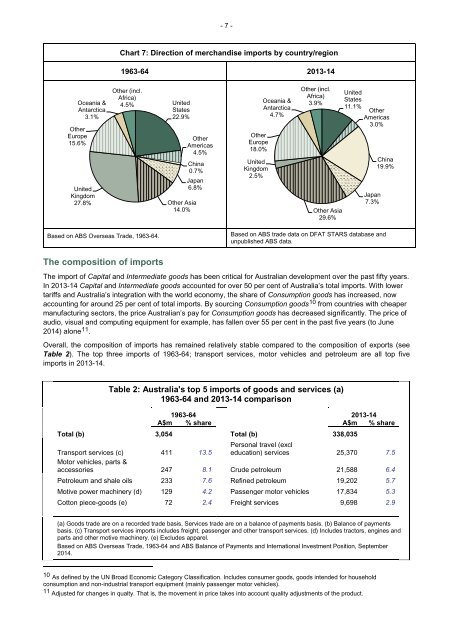
Chart 7: Direction of merchandise imports by country/region<br />
1963-64 <strong>2013</strong>-<strong>14</strong><br />
Oceania &<br />
Antarctica<br />
3.1%<br />
Other<br />
Europe<br />
15.6%<br />
United<br />
Kingdom<br />
27.8%<br />
Other (incl.<br />
Africa)<br />
4.5%<br />
United<br />
States<br />
22.9%<br />
Other<br />
Americas<br />
4.5%<br />
China<br />
0.7%<br />
Japan<br />
6.8%<br />
Other Asia<br />
<strong>14</strong>.0%<br />
Other<br />
Europe<br />
18.0%<br />
United<br />
Kingdom<br />
2.5%<br />
Oceania &<br />
Antarctica<br />
4.7%<br />
Other (incl.<br />
Africa)<br />
3.9%<br />
Other Asia<br />
29.6%<br />
United<br />
States<br />
11.1%<br />
Other<br />
Americas<br />
3.0%<br />
Japan<br />
7.3%<br />
China<br />
19.9%<br />
Based on ABS Overseas Trade, 1963-64.<br />
Based on ABS trade data on DFAT STARS database and<br />
unpublished ABS data.<br />
The composition of imports<br />
The import of Capital and Intermediate goods has been critical for Australian development over the past fifty years.<br />
In <strong>2013</strong>-<strong>14</strong> Capital and Intermediate goods accounted for over 50 per cent of Australia’s total imports. With lower<br />
tariffs and Australia’s integration with the world economy, the share of Consumption goods has increased, now<br />
accounting for around 25 per cent of total imports. By sourcing Consumption goods 10 from countries with cheaper<br />
manufacturing sectors, the price Australian’s pay for Consumption goods has decreased significantly. The price of<br />
audio, visual and computing equipment for example, has fallen over 55 per cent in the past five years (to June<br />
20<strong>14</strong>) alone 11 .<br />
Overall, the composition of imports has remained relatively stable compared to the composition of exports (see<br />
Table 2). The top three imports of 1963-64; transport services, motor vehicles and petroleum are all top five<br />
imports in <strong>2013</strong>-<strong>14</strong>.<br />
Table 2: Australia's top 5 imports of goods and services (a)<br />
1963-64 and <strong>2013</strong>-<strong>14</strong> comparison<br />
1963-64 <strong>2013</strong>-<strong>14</strong><br />
A$m % share A$m % share<br />
Total (b) 3,054 Total (b) 338,035<br />
Transport services (c) 411 13.5<br />
Personal travel (excl<br />
education) services 25,370 7.5<br />
Motor vehicles, parts &<br />
accessories 247 8.1 Crude petroleum 21,588 6.4<br />
Petroleum and shale oils 233 7.6 Refined petroleum 19,202 5.7<br />
Motive power machinery (d) 129 4.2 Passenger motor vehicles 17,834 5.3<br />
Cotton piece-goods (e) 72 2.4 Freight services 9,698 2.9<br />
(a) Goods trade are on a recorded trade basis, Services trade are on a balance of payments basis. (b) Balance of payments<br />
basis. (c) Transport services imports includes freight, passenger and other transport services. (d) Includes tractors, engines and<br />
parts and other motive machinery. (e) Excludes apparel.<br />
Based on ABS Overseas Trade, 1963-64 and ABS Balance of Payments and International Investment Position, September<br />
20<strong>14</strong>.<br />
10 As defined by the UN Broad Economic Category Classification. Includes consumer goods, goods intended for household<br />
consumption and non-industrial transport equipment (mainly passenger motor vehicles).<br />
11 Adjusted for changes in qualty. That is, the movement in price takes into account quality adjustments of the product.