

cot-fy-2013-14
cot-fy-2013-14
cot-fy-2013-14

Create successful ePaper yourself
Turn your PDF publications into a flip-book with our unique Google optimized e-Paper software.
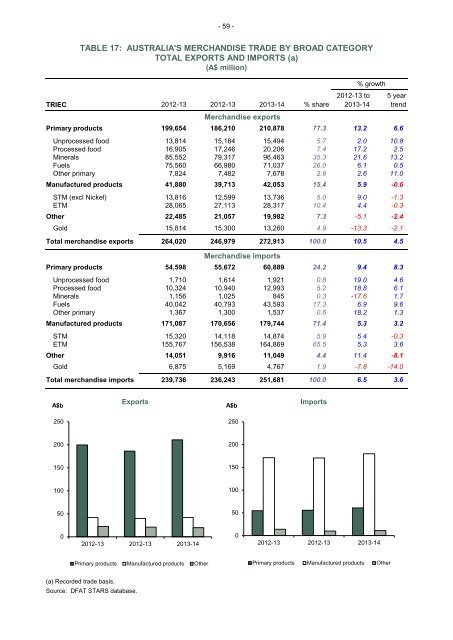
- 59 -<br />
TABLE 17: AUSTRALIA'S MERCHANDISE TRADE BY BROAD CATEGORY<br />
TOTAL EXPORTS AND IMPORTS (a)<br />
(A$ million)<br />
2012-13 to 5 year<br />
TRIEC 2012-13 2012-13 <strong>2013</strong>-<strong>14</strong> % share <strong>2013</strong>-<strong>14</strong> trend<br />
Merchandise exports<br />
Primary products 199,654 186,210 210,878 77.3 13.2 6.6<br />
Unprocessed food 13,8<strong>14</strong> 15,184 15,494 5.7 2.0 10.8<br />
Processed food 16,905 17,246 20,206 7.4 17.2 2.5<br />
Minerals 85,552 79,317 96,463 35.3 21.6 13.2<br />
Fuels 75,560 66,980 71,037 26.0 6.1 0.5<br />
Other primary 7,824 7,482 7,678 2.8 2.6 11.0<br />
Manufactured products 41,880 39,713 42,053 15.4 5.9 -0.6<br />
STM (excl Nickel) 13,816 12,599 13,736 5.0 9.0 -1.3<br />
ETM 28,065 27,113 28,317 10.4 4.4 -0.3<br />
Other 22,485 21,057 19,982 7.3 -5.1 -2.4<br />
Gold 15,8<strong>14</strong> 15,300 13,260 4.9 -13.3 -2.1<br />
Total merchandise exports 264,020 246,979 272,913 100.0 10.5 4.5<br />
Merchandise imports<br />
% growth<br />
Primary products 54,598 55,672 60,889 24.2 9.4 8.3<br />
Unprocessed food 1,710 1,6<strong>14</strong> 1,921 0.8 19.0 4.6<br />
Processed food 10,324 10,940 12,993 5.2 18.8 6.1<br />
Minerals 1,156 1,025 845 0.3 -17.6 1.7<br />
Fuels 40,042 40,793 43,593 17.3 6.9 9.6<br />
Other primary 1,367 1,300 1,537 0.6 18.2 1.3<br />
Manufactured products 171,087 170,656 179,744 71.4 5.3 3.2<br />
STM 15,320 <strong>14</strong>,118 <strong>14</strong>,874 5.9 5.4 -0.3<br />
ETM 155,767 156,538 164,869 65.5 5.3 3.6<br />
Other <strong>14</strong>,051 9,916 11,049 4.4 11.4 -8.1<br />
Gold 6,875 5,169 4,767 1.9 -7.8 -<strong>14</strong>.0<br />
Total merchandise imports 239,736 236,243 251,681 100.0 6.5 3.6<br />
Exports<br />
Imports<br />
250<br />
250<br />
200<br />
200<br />
150<br />
150<br />
100<br />
100<br />
50<br />
50<br />
0<br />
2012-13 2012-13 <strong>2013</strong>-<strong>14</strong><br />
0<br />
2012-13 2012-13 <strong>2013</strong>-<strong>14</strong><br />
Primary products Manufactured products Other<br />
Primary products Manufactured products Other<br />
(a) Recorded trade basis.<br />
Source: DFAT STARS database.