

cot-fy-2013-14
cot-fy-2013-14
cot-fy-2013-14

You also want an ePaper? Increase the reach of your titles
YUMPU automatically turns print PDFs into web optimized ePapers that Google loves.
- 125 -<br />
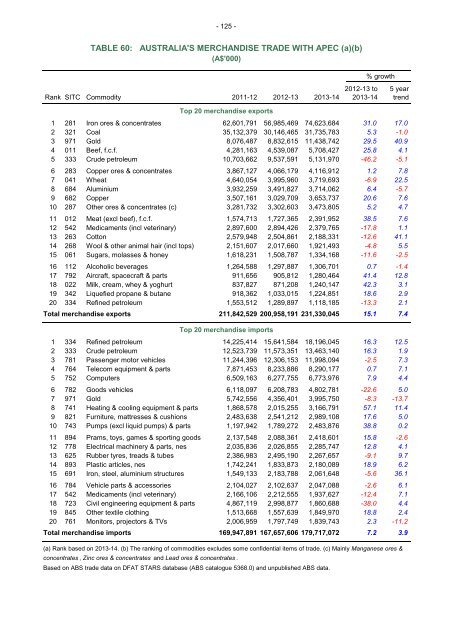
TABLE 60: AUSTRALIA'S MERCHANDISE TRADE WITH APEC (a)(b)<br />
(A$'000)<br />
% growth<br />
2012-13 to 5 year<br />
Rank SITC Commodity 2011-12 2012-13 <strong>2013</strong>-<strong>14</strong> <strong>2013</strong>-<strong>14</strong> trend<br />
Top 20 merchandise exports<br />
1 281 Iron ores & concentrates 62,601,791 56,985,469 74,623,684 31.0 17.0<br />
2 321 Coal 35,132,379 30,<strong>14</strong>6,465 31,735,783 5.3 -1.0<br />
3 971 Gold 8,076,487 8,832,615 11,438,742 29.5 40.9<br />
4 011 Beef, f.c.f. 4,281,163 4,539,087 5,708,427 25.8 4.1<br />
5 333 Crude petroleum 10,703,662 9,537,591 5,131,970 -46.2 -5.1<br />
6 283 Copper ores & concentrates 3,867,127 4,066,179 4,116,912 1.2 7.8<br />
7 041 Wheat 4,640,054 3,995,960 3,719,693 -6.9 22.5<br />
8 684 Aluminium 3,932,259 3,491,827 3,7<strong>14</strong>,062 6.4 -5.7<br />
9 682 Copper 3,507,161 3,029,709 3,653,737 20.6 7.6<br />
10 287 Other ores & concentrates (c) 3,281,732 3,302,603 3,473,805 5.2 4.7<br />
11 012 Meat (excl beef), f.c.f. 1,574,713 1,727,365 2,391,952 38.5 7.6<br />
12 542 Medicaments (incl veterinary) 2,897,600 2,894,426 2,379,765 -17.8 1.1<br />
13 263 Cotton 2,579,948 2,504,861 2,188,331 -12.6 41.1<br />
<strong>14</strong> 268 Wool & other animal hair (incl tops) 2,151,607 2,017,660 1,921,493 -4.8 5.5<br />
15 061 Sugars, molasses & honey 1,618,231 1,508,787 1,334,168 -11.6 -2.5<br />
16 112 Alcoholic beverages 1,264,588 1,297,887 1,306,701 0.7 -1.4<br />
17 792 Aircraft, spacecraft & parts 911,656 905,812 1,280,464 41.4 12.8<br />
18 022 Milk, cream, whey & yoghurt 837,827 871,208 1,240,<strong>14</strong>7 42.3 3.1<br />
19 342 Liquefied propane & butane 918,362 1,033,015 1,224,851 18.6 2.9<br />
20 334 Refined petroleum 1,553,512 1,289,897 1,118,185 -13.3 2.1<br />
Total merchandise exports 211,842,529 200,958,191 231,330,045 15.1 7.4<br />
Top 20 merchandise imports<br />
1 334 Refined petroleum <strong>14</strong>,225,4<strong>14</strong> 15,641,584 18,196,045 16.3 12.5<br />
2 333 Crude petroleum 12,523,739 11,573,351 13,463,<strong>14</strong>0 16.3 1.9<br />
3 781 Passenger motor vehicles 11,244,396 12,306,153 11,998,094 -2.5 7.3<br />
4 764 Telecom equipment & parts 7,871,453 8,233,886 8,290,177 0.7 7.1<br />
5 752 Computers 6,509,163 6,277,755 6,773,976 7.9 4.4<br />
6 782 Goods vehicles 6,118,097 6,208,783 4,802,781 -22.6 5.0<br />
7 971 Gold 5,742,556 4,356,401 3,995,750 -8.3 -13.7<br />
8 741 Heating & cooling equipment & parts 1,868,578 2,015,255 3,166,791 57.1 11.4<br />
9 821 Furniture, mattresses & cushions 2,483,638 2,541,212 2,989,108 17.6 5.0<br />
10 743 Pumps (excl liquid pumps) & parts 1,197,942 1,789,272 2,483,876 38.8 0.2<br />
11 894 Prams, toys, games & sporting goods 2,137,548 2,088,361 2,418,601 15.8 -2.6<br />
12 778 Electrical machinery & parts, nes 2,035,836 2,026,855 2,285,747 12.8 4.1<br />
13 625 Rubber tyres, treads & tubes 2,386,983 2,495,190 2,267,657 -9.1 9.7<br />
<strong>14</strong> 893 Plastic articles, nes 1,742,241 1,833,873 2,180,089 18.9 6.2<br />
15 691 Iron, steel, aluminium structures 1,549,133 2,183,788 2,061,648 -5.6 36.1<br />
16 784 Vehicle parts & accessories 2,104,027 2,102,637 2,047,088 -2.6 6.1<br />
17 542 Medicaments (incl veterinary) 2,166,106 2,212,555 1,937,627 -12.4 7.1<br />
18 723 Civil engineering equipment & parts 4,867,119 2,998,877 1,860,688 -38.0 4.4<br />
19 845 Other textile clothing 1,513,668 1,557,639 1,849,970 18.8 2.4<br />
20 761 Monitors, projectors & TVs 2,006,959 1,797,749 1,839,743 2.3 -11.2<br />
Total merchandise imports 169,947,891 167,657,606 179,717,072 7.2 3.9<br />
(a) Rank based on <strong>2013</strong>-<strong>14</strong>. (b) The ranking of commodities excludes some confidential items of trade. (c) Mainly Manganese ores &<br />
concentrates , Zinc ores & concentrates and Lead ores & concentrates .<br />
Based on ABS trade data on DFAT STARS database (ABS catalogue 5368.0) and unpublished ABS data.