

cot-fy-2013-14
cot-fy-2013-14
cot-fy-2013-14

You also want an ePaper? Increase the reach of your titles
YUMPU automatically turns print PDFs into web optimized ePapers that Google loves.
- 21 -<br />
Australia’s imports of aircraft & parts -<br />
update for <strong>2013</strong><br />
Introduction<br />
This article updates analysis on the impact of confidentiality in Australia Bureau of Statistics (ABS) international<br />
merchandise trade statistics on imports of aircraft and parts. To avoid divulging commercially-sensitive details of<br />
individual firms, the ABS restricts release of statistics on certain commodities. These restrictions have led to the<br />
partial restriction of data released for imports of SITC code 792 - Aircraft, spacecraft & related parts and related<br />
trade country import totals in ABS reported data.<br />
Below we provide an estimate of those imports, drawing on publicly available information including data from the<br />
countries where these imports are sourced.<br />
Estimates of imports of aircraft and related parts in <strong>2013</strong><br />
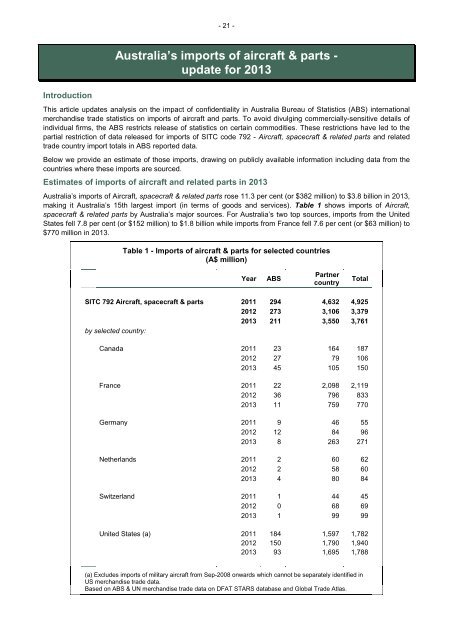
Australia’s imports of Aircraft, spacecraft & related parts rose 11.3 per cent (or $382 million) to $3.8 billion in <strong>2013</strong>,<br />
making it Australia’s 15th largest import (in terms of goods and services). Table 1 shows imports of Aircraft,<br />
spacecraft & related parts by Australia’s major sources. For Australia’s two top sources, imports from the United<br />
States fell 7.8 per cent (or $152 million) to $1.8 billion while imports from France fell 7.6 per cent (or $63 million) to<br />
$770 million in <strong>2013</strong>.<br />
Table 1 - Imports of aircraft & parts for selected countries<br />
(A$ million)<br />
Year<br />
ABS<br />
Partner<br />
country<br />
Total<br />
SITC 792 Aircraft, spacecraft & parts 2011 294 4,632 4,925<br />
2012 273 3,106 3,379<br />
<strong>2013</strong> 211 3,550 3,761<br />
by selected country:<br />
Canada 2011 23 164 187<br />
2012 27 79 106<br />
<strong>2013</strong> 45 105 150<br />
France 2011 22 2,098 2,119<br />
2012 36 796 833<br />
<strong>2013</strong> 11 759 770<br />
Germany 2011 9 46 55<br />
2012 12 84 96<br />
<strong>2013</strong> 8 263 271<br />
Netherlands 2011 2 60 62<br />
2012 2 58 60<br />
<strong>2013</strong> 4 80 84<br />
Switzerland 2011 1 44 45<br />
2012 0 68 69<br />
<strong>2013</strong> 1 99 99<br />
United States (a) 2011 184 1,597 1,782<br />
2012 150 1,790 1,940<br />
<strong>2013</strong> 93 1,695 1,788<br />
(a) Excludes imports of military aircraft from Sep-2008 onwards which cannot be separately identified in<br />
US merchandise trade data.<br />
Based on ABS & UN merchandise trade data on DFAT STARS database and Global Trade Atlas.