

cot-fy-2013-14
cot-fy-2013-14
cot-fy-2013-14

You also want an ePaper? Increase the reach of your titles
YUMPU automatically turns print PDFs into web optimized ePapers that Google loves.
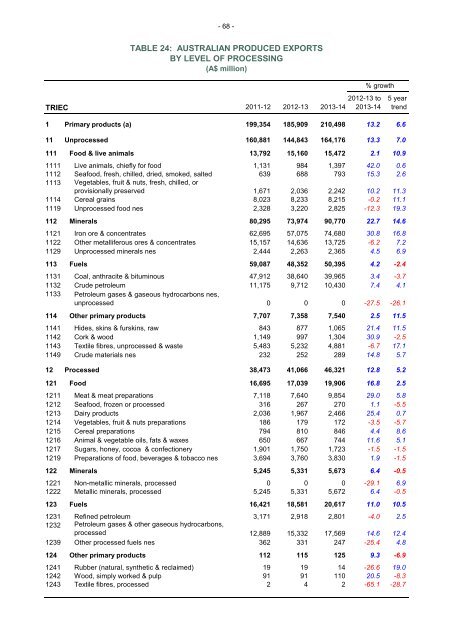
- 68 -<br />
TABLE 24: AUSTRALIAN PRODUCED EXPORTS<br />
BY LEVEL OF PROCESSING<br />
(A$ million)<br />
% growth<br />
2012-13 to 5 year<br />
TRIEC 2011-12 2012-13 <strong>2013</strong>-<strong>14</strong> <strong>2013</strong>-<strong>14</strong> trend<br />
1 Primary products (a) 199,354 185,909 210,498 13.2 6.6<br />
11 Unprocessed 160,881 <strong>14</strong>4,843 164,176 13.3 7.0<br />
111 Food & live animals 13,792 15,160 15,472 2.1 10.9<br />
1111 Live animals, chiefly for food 1,131 984 1,397 42.0 0.6<br />
1112 Seafood, fresh, chilled, dried, smoked, salted 639 688 793 15.3 2.6<br />
1113 Vegetables, fruit & nuts, fresh, chilled, or<br />
provisionally preserved 1,671 2,036 2,242 10.2 11.3<br />
11<strong>14</strong> Cereal grains 8,023 8,233 8,215 -0.2 11.1<br />
1119 Unprocessed food nes 2,328 3,220 2,825 -12.3 19.3<br />
112 Minerals 80,295 73,974 90,770 22.7 <strong>14</strong>.6<br />
1121 Iron ore & concentrates 62,695 57,075 74,680 30.8 16.8<br />
1122 Other metalliferous ores & concentrates 15,157 <strong>14</strong>,636 13,725 -6.2 7.2<br />
1129 Unprocessed minerals nes 2,444 2,263 2,365 4.5 6.9<br />
113 Fuels 59,087 48,352 50,395 4.2 -2.4<br />
1131 Coal, anthracite & bituminous 47,912 38,640 39,965 3.4 -3.7<br />
1132 Crude petroleum 11,175 9,712 10,430 7.4 4.1<br />
1133 Petroleum gases & gaseous hydrocarbons nes,<br />
unprocessed 0 0 0 -27.5 -26.1<br />
1<strong>14</strong> Other primary products 7,707 7,358 7,540 2.5 11.5<br />
1<strong>14</strong>1 Hides, skins & furskins, raw 843 877 1,065 21.4 11.5<br />
1<strong>14</strong>2 Cork & wood 1,<strong>14</strong>9 997 1,304 30.9 -2.5<br />
1<strong>14</strong>3 Textile fibres, unprocessed & waste 5,483 5,232 4,881 -6.7 17.1<br />
1<strong>14</strong>9 Crude materials nes 232 252 289 <strong>14</strong>.8 5.7<br />
12 Processed 38,473 41,066 46,321 12.8 5.2<br />
121 Food 16,695 17,039 19,906 16.8 2.5<br />
1211 Meat & meat preparations 7,118 7,640 9,854 29.0 5.8<br />
1212 Seafood, frozen or processed 316 267 270 1.1 -5.5<br />
1213 Dairy products 2,036 1,967 2,466 25.4 0.7<br />
12<strong>14</strong> Vegetables, fruit & nuts preparations 186 179 172 -3.5 -5.7<br />
1215 Cereal preparations 794 810 846 4.4 8.6<br />
1216 Animal & vegetable oils, fats & waxes 650 667 744 11.6 5.1<br />
1217 Sugars, honey, cocoa & confectionery 1,901 1,750 1,723 -1.5 -1.5<br />
1219 Preparations of food, beverages & tobacco nes 3,694 3,760 3,830 1.9 -1.5<br />
122 Minerals 5,245 5,331 5,673 6.4 -0.5<br />
1221 Non-metallic minerals, processed 0 0 0 -29.1 6.9<br />
1222 Metallic minerals, processed 5,245 5,331 5,672 6.4 -0.5<br />
123 Fuels 16,421 18,581 20,617 11.0 10.5<br />
1231 Refined petroleum 3,171 2,918 2,801 -4.0 2.5<br />
1232 Petroleum gases & other gaseous hydrocarbons,<br />
processed 12,889 15,332 17,569 <strong>14</strong>.6 12.4<br />
1239 Other processed fuels nes 362 331 247 -25.4 4.8<br />
124 Other primary products 112 115 125 9.3 -6.9<br />
1241 Rubber (natural, synthetic & reclaimed) 19 19 <strong>14</strong> -26.6 19.0<br />
1242 Wood, simply worked & pulp 91 91 110 20.5 -8.3<br />
1243 Textile fibres, processed 2 4 2 -65.1 -28.7