

cot-fy-2013-14
cot-fy-2013-14
cot-fy-2013-14

You also want an ePaper? Increase the reach of your titles
YUMPU automatically turns print PDFs into web optimized ePapers that Google loves.
- 45 -<br />
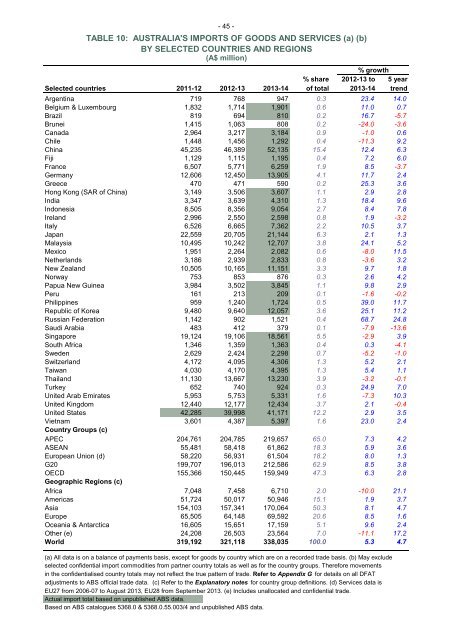
TABLE 10: AUSTRALIA'S IMPORTS OF GOODS AND SERVICES (a) (b)<br />
BY SELECTED COUNTRIES AND REGIONS<br />
(A$ million)<br />
% growth<br />
% share 2012-13 to 5 year<br />
Selected countries 2011-12 2012-13 <strong>2013</strong>-<strong>14</strong> of total <strong>2013</strong>-<strong>14</strong> trend<br />
Argentina 719 768 947 0.3 23.4 <strong>14</strong>.0<br />
Belgium & Luxembourg 1,832 1,7<strong>14</strong> 1,901 0.6 11.0 0.7<br />
Brazil 819 694 810 0.2 16.7 -5.7<br />
Brunei 1,415 1,063 808 0.2 -24.0 -3.6<br />
Canada 2,964 3,217 3,184 0.9 -1.0 0.6<br />
Chile 1,448 1,456 1,292 0.4 -11.3 9.2<br />
China 45,235 46,389 52,135 15.4 12.4 6.3<br />
Fiji 1,129 1,115 1,195 0.4 7.2 6.0<br />
France 6,507 5,771 6,259 1.9 8.5 -3.7<br />
Germany 12,606 12,450 13,905 4.1 11.7 2.4<br />
Greece 470 471 590 0.2 25.3 3.6<br />
Hong Kong (SAR of China) 3,<strong>14</strong>9 3,506 3,607 1.1 2.9 2.8<br />
India 3,347 3,639 4,310 1.3 18.4 9.6<br />
Indonesia 8,505 8,356 9,054 2.7 8.4 7.8<br />
Ireland 2,996 2,550 2,598 0.8 1.9 -3.2<br />
Italy 6,526 6,665 7,362 2.2 10.5 3.7<br />
Japan 22,559 20,705 21,<strong>14</strong>4 6.3 2.1 1.3<br />
Malaysia 10,495 10,242 12,707 3.8 24.1 5.2<br />
Mexico 1,951 2,264 2,082 0.6 -8.0 11.5<br />
Netherlands 3,186 2,939 2,833 0.8 -3.6 3.2<br />
New Zealand 10,505 10,165 11,151 3.3 9.7 1.8<br />
Norway 753 853 876 0.3 2.6 4.2<br />
Papua New Guinea 3,984 3,502 3,845 1.1 9.8 2.9<br />
Peru 161 213 209 0.1 -1.6 -0.2<br />
Philippines 959 1,240 1,724 0.5 39.0 11.7<br />
Republic of Korea 9,480 9,640 12,057 3.6 25.1 11.2<br />
Russian Federation 1,<strong>14</strong>2 902 1,521 0.4 68.7 24.8<br />
Saudi Arabia 483 412 379 0.1 -7.9 -13.6<br />
Singapore 19,124 19,106 18,561 5.5 -2.9 3.9<br />
South Africa 1,346 1,359 1,363 0.4 0.3 -4.1<br />
Sweden 2,629 2,424 2,298 0.7 -5.2 -1.0<br />
Switzerland 4,172 4,095 4,306 1.3 5.2 2.1<br />
Taiwan 4,030 4,170 4,395 1.3 5.4 1.1<br />
Thailand 11,130 13,667 13,230 3.9 -3.2 -0.1<br />
Turkey 652 740 924 0.3 24.9 7.0<br />
United Arab Emirates 5,953 5,753 5,331 1.6 -7.3 10.3<br />
United Kingdom 12,440 12,177 12,434 3.7 2.1 -0.4<br />
United States 42,285 39,998 41,171 12.2 2.9 3.5<br />
Vietnam 3,601 4,387 5,397 1.6 23.0 2.4<br />
Country Groups (c)<br />
APEC 204,761 204,785 219,657 65.0 7.3 4.2<br />
ASEAN 55,481 58,418 61,862 18.3 5.9 3.6<br />
European Union (d) 58,220 56,931 61,504 18.2 8.0 1.3<br />
G20 199,707 196,013 212,586 62.9 8.5 3.8<br />
OECD 155,366 150,445 159,949 47.3 6.3 2.8<br />
Geographic Regions (c)<br />
Africa 7,048 7,458 6,710 2.0 -10.0 21.1<br />
Americas 51,724 50,017 50,946 15.1 1.9 3.7<br />
Asia 154,103 157,341 170,064 50.3 8.1 4.7<br />
Europe 65,505 64,<strong>14</strong>8 69,592 20.6 8.5 1.6<br />
Oceania & Antarctica 16,605 15,651 17,159 5.1 9.6 2.4<br />
Other (e) 24,208 26,503 23,564 7.0 -11.1 17.2<br />
World 319,192 321,118 338,035 100.0 5.3 4.7<br />
(a) All data is on a balance of payments basis, except for goods by country which are on a recorded trade basis. (b) May exclude<br />
selected confidential import commodities from partner country totals as well as for the country groups. Therefore movements<br />
in the confidentialised country totals may not reflect the true pattern of trade. Refer to Appendix G for details on all DFAT<br />
adjustments to ABS official trade data. (c) Refer to the Explanatory notes for country group definitions. (d) Services data is<br />
EU27 from 2006-07 to August <strong>2013</strong>, EU28 from September <strong>2013</strong>. (e) Includes unallocated and confidential trade.<br />
Actual import total based on unpublished ABS data.<br />
Based on ABS catalogues 5368.0 & 5368.0.55.003/4 and unpublished ABS data.