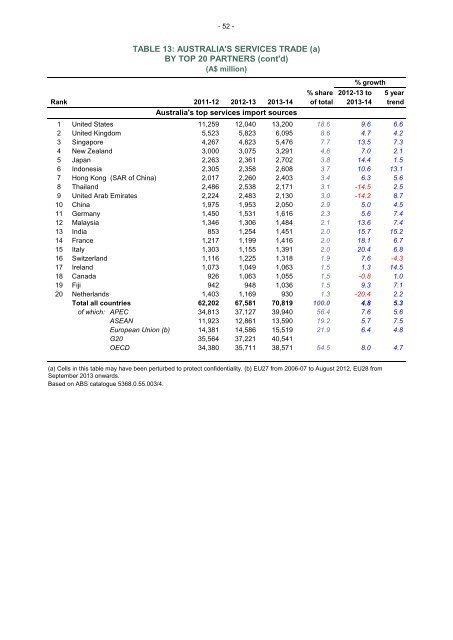
- 52 - TABLE 13: AUSTRALIA'S SERVICES TRADE (a) BY TOP 20 PARTNERS (cont'd) (A$ million) % growth % share 2012-13 to 5 year Rank 2011-12 2012-13 <strong>2013</strong>-<strong>14</strong> of total <strong>2013</strong>-<strong>14</strong> trend Australia's top services import sources 1 United States 11,259 12,040 13,200 18.6 9.6 6.6 2 United Kingdom 5,523 5,823 6,095 8.6 4.7 4.2 3 Singapore 4,267 4,823 5,476 7.7 13.5 7.3 4 New Zealand 3,000 3,075 3,291 4.6 7.0 2.1 5 Japan 2,263 2,361 2,702 3.8 <strong>14</strong>.4 1.5 6 Indonesia 2,305 2,358 2,608 3.7 10.6 13.1 7 Hong Kong (SAR of China) 2,017 2,260 2,403 3.4 6.3 5.6 8 Thailand 2,486 2,538 2,171 3.1 -<strong>14</strong>.5 2.5 9 United Arab Emirates 2,224 2,483 2,130 3.0 -<strong>14</strong>.2 8.7 10 China 1,975 1,953 2,050 2.9 5.0 4.5 11 Germany 1,450 1,531 1,616 2.3 5.6 7.4 12 Malaysia 1,346 1,306 1,484 2.1 13.6 7.4 13 India 853 1,254 1,451 2.0 15.7 15.2 <strong>14</strong> France 1,217 1,199 1,416 2.0 18.1 6.7 15 Italy 1,303 1,155 1,391 2.0 20.4 6.8 16 Switzerland 1,116 1,225 1,318 1.9 7.6 -4.3 17 Ireland 1,073 1,049 1,063 1.5 1.3 <strong>14</strong>.5 18 Canada 926 1,063 1,055 1.5 -0.8 1.0 19 Fiji 942 948 1,036 1.5 9.3 7.1 20 Netherlands 1,403 1,169 930 1.3 -20.4 2.2 Total all countries 62,202 67,581 70,819 100.0 4.8 5.3 of which: APEC 34,813 37,127 39,940 56.4 7.6 5.6 ASEAN 11,923 12,861 13,590 19.2 5.7 7.5 European Union (b) <strong>14</strong>,381 <strong>14</strong>,586 15,519 21.9 6.4 4.8 G20 35,564 37,221 40,541 OECD 34,380 35,711 38,571 54.5 8.0 4.7 (a) Cells in this table may have been perturbed to protect confidentiality. (b) EU27 from 2006-07 to August 2012, EU28 from September <strong>2013</strong> onwards. Based on ABS catalogue 5368.0.55.003/4.
- 53 - TABLE <strong>14</strong>: AUSTRALIA'S SERVICES TRADE (a) BY SELECTED COUNTRIES AND REGIONS (A$ million) % growth % share 2012-13 to 5 year 2011-12 2012-13 <strong>2013</strong>-<strong>14</strong> of total <strong>2013</strong>-<strong>14</strong> trend Selected countries Argentina 167 203 194 0.2 -4.4 -1.6 Belgium & Luxembourg 306 240 268 0.2 11.7 4.0 Brazil 512 535 760 0.6 42.1 3.7 Brunei 116 135 117 0.1 -13.3 -3.1 Canada 1,816 1,833 1,910 1.5 4.2 1.0 Chile 495 347 413 0.3 19.0 -2.8 China 8,180 8,680 9,537 7.4 9.9 7.2 Fiji 1,078 1,079 1,180 0.9 9.4 5.8 France 1,858 1,859 2,157 1.7 16.0 3.8 Germany 2,563 2,705 2,717 2.1 0.4 4.4 Greece 371 381 478 0.4 25.5 5.5 Hong Kong (SAR of China) 3,675 4,131 4,311 3.4 4.4 5.3 India 3,102 3,204 3,549 2.8 10.8 -3.9 Indonesia 3,431 3,509 3,895 3.0 11.0 9.6 Ireland 1,673 1,736 1,669 1.3 -3.9 10.4 Italy 1,675 1,587 1,906 1.5 20.1 7.4 Japan 4,459 4,524 4,707 3.7 4.0 -0.5 Malaysia 2,937 2,919 3,250 2.5 11.3 4.4 Mexico 131 155 199 0.2 28.4 7.6 Netherlands 1,766 1,630 1,411 1.1 -13.4 1.7 New Zealand 6,408 6,606 7,167 5.6 8.5 3.0 Norway 7<strong>14</strong> 731 685 0.5 -6.3 9.2 Papua New Guinea 1,037 1,057 889 0.7 -15.9 4.6 Peru <strong>14</strong>1 161 185 0.1 <strong>14</strong>.9 4.4 Philippines 936 1,204 1,263 1.0 4.9 12.8 Republic of Korea 2,326 2,208 2,327 1.8 5.4 -0.5 Russian Federation 212 238 268 0.2 12.6 7.6 Saudi Arabia 380 386 384 0.3 -0.5 0.9 Singapore 7,528 8,350 9,056 7.1 8.5 5.5 South Africa 964 902 860 0.7 -4.7 -1.2 Sweden 333 360 450 0.4 25.0 -0.4 Switzerland 1,839 1,960 2,261 1.8 15.4 -2.2 Taiwan 759 995 1,000 0.8 0.5 4.3 Thailand 3,303 3,333 3,019 2.4 -9.4 0.8 Turkey 281 274 307 0.2 12.0 5.8 United Arab Emirates 2,658 2,943 2,722 2.1 -7.5 6.6 United Kingdom 9,485 9,997 10,263 8.0 2.7 2.6 United States 16,702 17,793 19,599 15.3 10.2 5.2 Vietnam 1,669 1,775 1,962 1.5 10.5 7.4 Country Groups (b) APEC 66,251 69,938 75,053 58.5 7.3 4.5 ASEAN 20,216 21,558 22,935 17.9 6.4 5.7 European Union (c) 23,043 23,836 24,898 19.4 4.5 3.5 G20 65,706 68,280 73,394 57.2 7.5 3.6 OECD 58,129 60,183 64,225 50.1 6.7 3.4 Geographic Regions (b) Africa 2,168 2,105 1,968 1.5 -6.5 -3.7 Americas 20,654 21,892 24,212 18.9 10.6 4.4 Asia 49,948 52,930 55,907 43.6 5.6 4.1 Europe 26,858 27,806 28,989 22.6 4.3 2.6 Oceania 9,437 9,633 10,258 8.0 6.5 3.0 Other (d) 4,702 6,702 6,866 5.4 2.4 7.8 World 113,767 121,068 128,200 100.0 5.9 3.8 (a) Cells in this table may have been perturbed to protect confidentiality. (b) Refer to the Explanatory notes for country groupings. onwards. (c) EU27 from 2006-07 to August <strong>2013</strong>, EU28 from September <strong>2013</strong>. (d) Includes unallocated and confidential trade. Based on ABS catalogue 5368.0.55.003/4.