

cot-fy-2013-14
cot-fy-2013-14
cot-fy-2013-14

Create successful ePaper yourself
Turn your PDF publications into a flip-book with our unique Google optimized e-Paper software.
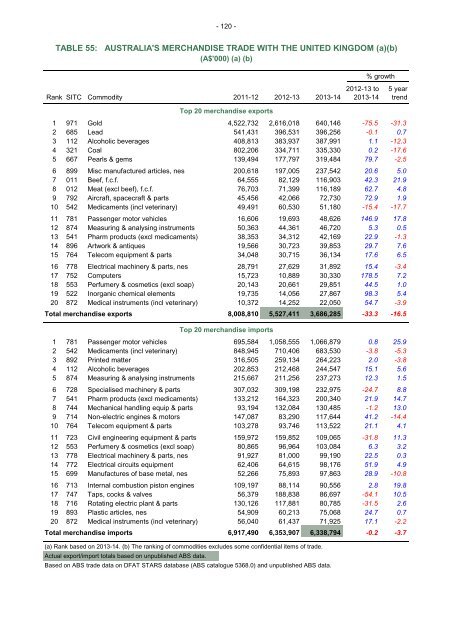
- 120 -<br />
TABLE 55: AUSTRALIA'S MERCHANDISE TRADE WITH THE UNITED KINGDOM (a)(b)<br />
(A$'000) (a) (b)<br />
% growth<br />
2012-13 to 5 year<br />
Rank SITC Commodity 2011-12 2012-13 <strong>2013</strong>-<strong>14</strong> <strong>2013</strong>-<strong>14</strong> trend<br />
Top 20 merchandise exports<br />
1 971 Gold 4,522,732 2,616,018 640,<strong>14</strong>6 -75.5 -31.3<br />
2 685 Lead 541,431 396,531 396,256 -0.1 0.7<br />
3 112 Alcoholic beverages 408,813 383,937 387,991 1.1 -12.3<br />
4 321 Coal 802,206 334,711 335,330 0.2 -17.6<br />
5 667 Pearls & gems 139,494 177,797 319,484 79.7 -2.5<br />
6 899 Misc manufactured articles, nes 200,618 197,005 237,542 20.6 5.0<br />
7 011 Beef, f.c.f. 64,555 82,129 116,903 42.3 21.9<br />
8 012 Meat (excl beef), f.c.f. 76,703 71,399 116,189 62.7 4.8<br />
9 792 Aircraft, spacecraft & parts 45,456 42,066 72,730 72.9 1.9<br />
10 542 Medicaments (incl veterinary) 49,491 60,530 51,180 -15.4 -17.7<br />
11 781 Passenger motor vehicles 16,606 19,693 48,626 <strong>14</strong>6.9 17.8<br />
12 874 Measuring & analysing instruments 50,363 44,361 46,720 5.3 0.5<br />
13 541 Pharm products (excl medicaments) 38,353 34,312 42,169 22.9 -1.3<br />
<strong>14</strong> 896 Artwork & antiques 19,566 30,723 39,853 29.7 7.6<br />
15 764 Telecom equipment & parts 34,048 30,715 36,134 17.6 6.5<br />
16 778 Electrical machinery & parts, nes 28,791 27,629 31,892 15.4 -3.4<br />
17 752 Computers 15,723 10,889 30,330 178.5 7.2<br />
18 553 Perfumery & cosmetics (excl soap) 20,<strong>14</strong>3 20,661 29,851 44.5 1.0<br />
19 522 Inorganic chemical elements 19,735 <strong>14</strong>,056 27,867 98.3 5.4<br />
20 872 Medical instruments (incl veterinary) 10,372 <strong>14</strong>,252 22,050 54.7 -3.9<br />
Total merchandise exports 8,008,810 5,527,411 3,686,285 -33.3 -16.5<br />
Top 20 merchandise imports<br />
1 781 Passenger motor vehicles 695,584 1,058,555 1,066,879 0.8 25.9<br />
2 542 Medicaments (incl veterinary) 848,945 710,406 683,530 -3.8 -5.3<br />
3 892 Printed matter 316,505 259,134 264,223 2.0 -3.8<br />
4 112 Alcoholic beverages 202,853 212,468 244,547 15.1 5.6<br />
5 874 Measuring & analysing instruments 215,667 211,256 237,273 12.3 1.5<br />
6 728 Specialised machinery & parts 307,032 309,198 232,975 -24.7 8.8<br />
7 541 Pharm products (excl medicaments) 133,212 164,323 200,340 21.9 <strong>14</strong>.7<br />
8 744 Mechanical handling equip & parts 93,194 132,084 130,485 -1.2 13.0<br />
9 7<strong>14</strong> Non-electric engines & motors <strong>14</strong>7,087 83,290 117,644 41.2 -<strong>14</strong>.4<br />
10 764 Telecom equipment & parts 103,278 93,746 113,522 21.1 4.1<br />
11 723 Civil engineering equipment & parts 159,972 159,852 109,065 -31.8 11.3<br />
12 553 Perfumery & cosmetics (excl soap) 80,865 96,964 103,084 6.3 3.2<br />
13 778 Electrical machinery & parts, nes 91,927 81,000 99,190 22.5 0.3<br />
<strong>14</strong> 772 Electrical circuits equipment 62,406 64,615 98,176 51.9 4.9<br />
15 699 Manufactures of base metal, nes 52,266 75,893 97,863 28.9 -10.8<br />
16 713 Internal combustion piston engines 109,197 88,1<strong>14</strong> 90,556 2.8 19.8<br />
17 747 Taps, cocks & valves 56,379 188,838 86,697 -54.1 10.5<br />
18 716 Rotating electric plant & parts 130,126 117,881 80,785 -31.5 2.6<br />
19 893 Plastic articles, nes 54,909 60,213 75,068 24.7 0.7<br />
20 872 Medical instruments (incl veterinary) 56,040 61,437 71,925 17.1 -2.2<br />
Total merchandise imports 6,917,490 6,353,907 6,338,794 -0.2 -3.7<br />
(a) Rank based on <strong>2013</strong>-<strong>14</strong>. (b) The ranking of commodities excludes some confidential items of trade.<br />
Actual export/import totals based on unpublished ABS data.<br />
Based on ABS trade data on DFAT STARS database (ABS catalogue 5368.0) and unpublished ABS data.