

cot-fy-2013-14
cot-fy-2013-14
cot-fy-2013-14

Create successful ePaper yourself
Turn your PDF publications into a flip-book with our unique Google optimized e-Paper software.
- 10 -<br />
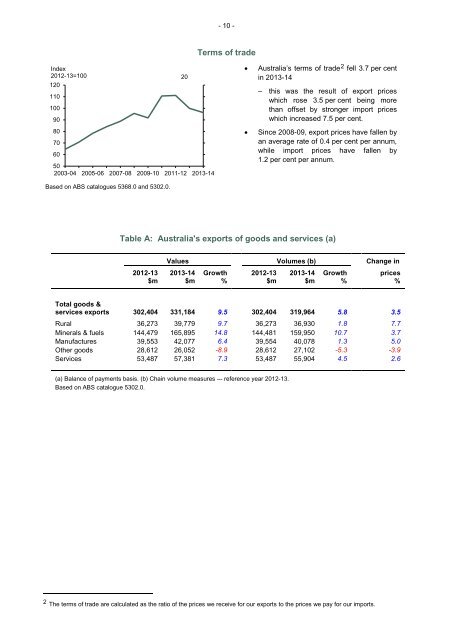
Terms of trade<br />
Index<br />
Index • Australia’s terms of trade 2 fell 3.7 per cent<br />
2012-13=100 2012-13=100 in <strong>2013</strong>-<strong>14</strong><br />
120<br />
120<br />
– this was the result of export prices<br />
110<br />
110<br />
which rose 3.5 per cent being more<br />
100<br />
100 than offset by stronger import prices<br />
90<br />
90 which increased 7.5 per cent.<br />
80<br />
80 • Since 2008-09, export prices have fallen by<br />
70<br />
70 an average rate of 0.4 per cent per annum,<br />
60<br />
60<br />
while import prices have fallen by<br />
1.2 per cent per annum.<br />
50<br />
50<br />
2003-04 2005-06 2007-08 2009-10 2011-12 <strong>2013</strong>-<strong>14</strong><br />
Based on ABS catalogues 5368.0 and 5302.0.<br />
Table A: Australia's exports of goods and services (a)<br />
Values Volumes (b) Change in<br />
2012-13 <strong>2013</strong>-<strong>14</strong> Growth 2012-13 <strong>2013</strong>-<strong>14</strong> Growth prices<br />
$m $m % $m $m % %<br />
Total goods &<br />
services exports 302,404 331,184 9.5 302,404 319,964 5.8 3.5<br />
Rural 36,273 39,779 9.7 36,273 36,930 1.8 7.7<br />
Minerals & fuels <strong>14</strong>4,479 165,895 <strong>14</strong>.8 <strong>14</strong>4,481 159,950 10.7 3.7<br />
Manufactures 39,553 42,077 6.4 39,554 40,078 1.3 5.0<br />
Other goods 28,612 26,052 -8.9 28,612 27,102 -5.3 -3.9<br />
Services 53,487 57,381 7.3 53,487 55,904 4.5 2.6<br />
(a) Balance of payments basis. (b) Chain volume measures –- reference year 2012-13.<br />
Based on ABS catalogue 5302.0.<br />
2 The terms of trade are calculated as the ratio of the prices we receive for our exports to the prices we pay for our imports.