Scheduleforming part of the Balance Sheet - Domain-b
Scheduleforming part of the Balance Sheet - Domain-b
Scheduleforming part of the Balance Sheet - Domain-b

You also want an ePaper? Increase the reach of your titles
YUMPU automatically turns print PDFs into web optimized ePapers that Google loves.
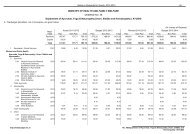
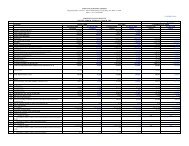
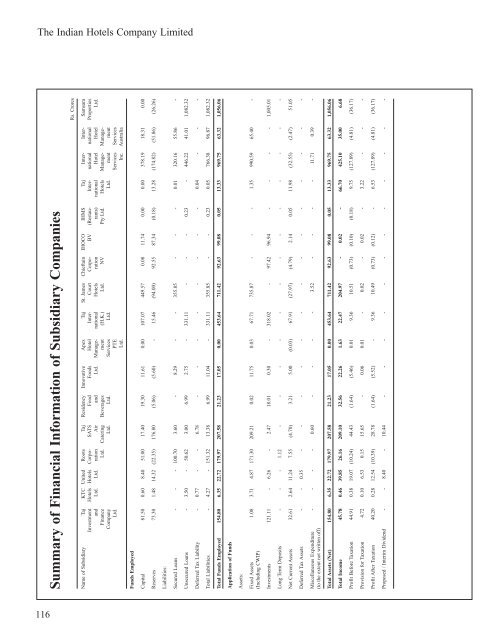
The Indian Hotels Company Limited<br />
Summary <strong>of</strong> Financial Information <strong>of</strong> Subsidiary Companies<br />
116<br />
Rs. Crores<br />
Name <strong>of</strong> Subsidiary Taj KTC United Roots Taj Residency Innovative Apex Taj St. James Chieftain IHOCO IHMS Taj Inter- Inter- Samsara<br />
Investment Hotels Hotels Corpo- SATS Food Foods Hotel Inter- Court Corpo- BV (Restau- Inter- national national Properties<br />
and Ltd. Ltd. ration Air and Ltd. Manage- national Hotels ration rants) national Hotel Hotel Ltd.<br />
Finance Ltd. Catering Beverages ment (H.K.) Ltd. NV Pty Ltd. Hotels Manage- Manage-<br />
Company Ltd. Ltd. Services Ltd. Ltd. ment ment<br />
Ltd. PTE Services Services<br />
Ltd. Inc. Australia<br />
Funds Employed<br />
Capital 81.50 0.60 8.40 51.00 17.40 19.30 11.61 0.00 107.07 449.57 0.08 11.74 0.00 0.00 378.19 18.31 0.00<br />
Reserves 73.30 1.48 14.32 (22.35) 176.80 (5.06) (5.60) - 15.46 (94.00) 92.55 87.34 (0.18) 13.28 (174.82) (51.86) (26.26)<br />
Liabilities:<br />
Secured Loans - - - 100.70 3.60 - 8.29 - - 355.85 - - - 0.01 320.16 55.86 -<br />
Unsecured Loans - 3.50 - 50.62 3.00 6.99 2.75 - 331.11 - - - 0.23 - 446.22 41.01 1,082.32<br />
Deferred Tax Liability - 0.77 - - 6.78 - - - - - - - - 0.04 - - -<br />
Total Liabilities - 4.27 - 151.32 13.38 6.99 11.04 - 331.11 355.85 - - 0.23 0.05 766.38 96.87 1,082.32<br />
Total Funds Employed 154.80 6.35 22.72 179.97 207.58 21.23 17.05 0.00 453.64 711.42 92.63 99.08 0.05 13.33 969.75 63.32 1,056.06<br />
Application <strong>of</strong> Funds<br />
Assets:<br />
Fixed Assets 1.08 3.71 4.87 171.30 209.21 0.02 11.75 0.03 67.71 735.87 - - - 1.35 990.59 65.40 -<br />
(Including CWIP)<br />
Investments 121.11 - 6.26 - 2.47 18.01 0.30 - 318.02 - 97.42 96.94 - - - - 1,005.01<br />
Long Term Deposits - - - 1.12 - - - - - - - - - - - - -<br />
Net Current Assets 32.61 2.64 11.24 7.55 (4.70) 3.21 5.00 (0.03) 67.91 (27.97) (4.79) 2.14 0.05 11.98 (32.55) (2.47) 51.05<br />
Deferred Tax Assets - - 0.35 - - - - - - - - - - - - - -<br />
Miscellaneous Expenditure - - - - 0.60 - - - - 3.52 - - - - 11.71 0.39 -<br />
(to <strong>the</strong> extent not written <strong>of</strong>f)<br />
Total Assets (Net) 154.80 6.35 22.72 179.97 207.58 21.23 17.05 0.00 453.64 711.42 92.63 99.08 0.05 13.33 969.75 63.32 1,056.06<br />
Total Income 45.78 0.46 39.85 26.16 209.10 32.56 22.26 1.63 22.47 204.97 - 0.02 - 66.70 425.10 35.00 6.68<br />
Pr<strong>of</strong>it Before Taxation 44.91 0.38 19.07 (10.24) 44.43 (1.64) (5.46) 0.01 9.36 10.51 (0.73) (0.10) (0.18) 9.75 (127.89) (4.81) (36.17)<br />
Provision for Taxation 4.72 0.10 6.53 0.15 15.65 - 0.06 0.01 - 0.02 - 0.02 - 3.22 - - -<br />
Pr<strong>of</strong>it After Taxation 40.20 0.28 12.54 (10.39) 28.78 (1.64) (5.52) - 9.36 10.49 (0.73) (0.12) - 6.53 (127.89) (4.81) (36.17)<br />
Proposed / Interim Dividend - - 8.40 - 10.44 - - - - - - - - - - - -