Rotorcraft Flying Handbook, FAA-H-8083-21
Rotorcraft Flying Handbook, FAA-H-8083-21
Rotorcraft Flying Handbook, FAA-H-8083-21

You also want an ePaper? Increase the reach of your titles
YUMPU automatically turns print PDFs into web optimized ePapers that Google loves.
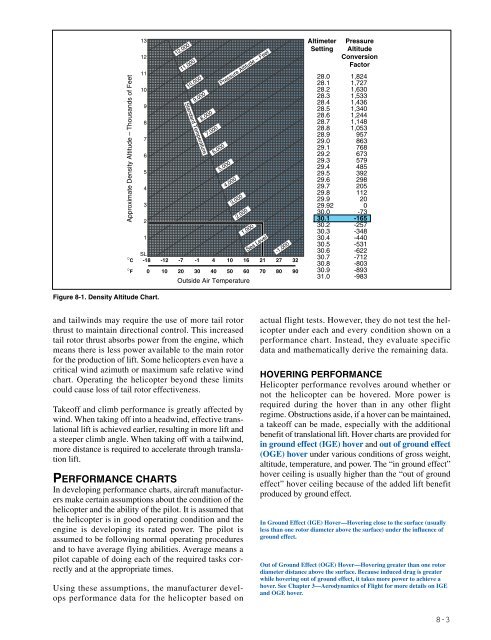
Approximate Density Altitude – Thousands of Feet<br />
13<br />
12<br />
11<br />
10<br />
9<br />
8<br />
7<br />
6<br />
5<br />
4<br />
3<br />
2<br />
1<br />
SL<br />
°C -18 -12<br />
°F 0 10<br />
12,000<br />
11,000<br />
10,000<br />
9,000<br />
Standard Temperature<br />
8,000<br />
7,000<br />
-7 -1 4 10<br />
20 30 40 50<br />
Pressure Altitude – Feet<br />
6,000<br />
5,000<br />
4,000<br />
3,000<br />
2,000<br />
1,000<br />
Sea Level<br />
Outside Air Temperature<br />
16 <strong>21</strong><br />
60 70<br />
-1,000<br />
27<br />
80<br />
32<br />
90<br />
Altimeter<br />
Setting<br />
28.0<br />
28.1<br />
28.2<br />
28.3<br />
28.4<br />
28.5<br />
28.6<br />
28.7<br />
28.8<br />
28.9<br />
29.0<br />
29.1<br />
29.2<br />
29.3<br />
29.4<br />
29.5<br />
29.6<br />
29.7<br />
29.8<br />
29.9<br />
29.92<br />
30.0<br />
30.1<br />
30.2<br />
30.3<br />
30.4<br />
30.5<br />
30.6<br />
30.7<br />
30.8<br />
30.9<br />
31.0<br />
Pressure<br />
Altitude<br />
Conversion<br />
Factor<br />
1,824<br />
1,727<br />
1,630<br />
1,533<br />
1,436<br />
1,340<br />
1,244<br />
1,148<br />
1,053<br />
957<br />
863<br />
768<br />
673<br />
579<br />
485<br />
392<br />
298<br />
205<br />
112<br />
20<br />
0<br />
-73<br />
-165<br />
-257<br />
-348<br />
-440<br />
-531<br />
-622<br />
-712<br />
-803<br />
-893<br />
-983<br />
Figure 8-1. Density Altitude Chart.<br />
and tailwinds may require the use of more tail rotor<br />
thrust to maintain directional control. This increased<br />
tail rotor thrust absorbs power from the engine, which<br />
means there is less power available to the main rotor<br />
for the production of lift. Some helicopters even have a<br />
critical wind azimuth or maximum safe relative wind<br />
chart. Operating the helicopter beyond these limits<br />
could cause loss of tail rotor effectiveness.<br />
Takeoff and climb performance is greatly affected by<br />
wind. When taking off into a headwind, effective translational<br />
lift is achieved earlier, resulting in more lift and<br />
a steeper climb angle. When taking off with a tailwind,<br />
more distance is required to accelerate through translation<br />
lift.<br />
PERFORMANCE CHARTS<br />
In developing performance charts, aircraft manufacturers<br />
make certain assumptions about the condition of the<br />
helicopter and the ability of the pilot. It is assumed that<br />
the helicopter is in good operating condition and the<br />
engine is developing its rated power. The pilot is<br />
assumed to be following normal operating procedures<br />
and to have average flying abilities. Average means a<br />
pilot capable of doing each of the required tasks correctly<br />
and at the appropriate times.<br />
Using these assumptions, the manufacturer develops<br />
performance data for the helicopter based on<br />
actual flight tests. However, they do not test the helicopter<br />
under each and every condition shown on a<br />
performance chart. Instead, they evaluate specific<br />
data and mathematically derive the remaining data.<br />
HOVERING PERFORMANCE<br />
Helicopter performance revolves around whether or<br />
not the helicopter can be hovered. More power is<br />
required during the hover than in any other flight<br />
regime. Obstructions aside, if a hover can be maintained,<br />
a takeoff can be made, especially with the additional<br />
benefit of translational lift. Hover charts are provided for<br />
in ground effect (IGE) hover and out of ground effect<br />
(OGE) hover under various conditions of gross weight,<br />
altitude, temperature, and power. The “in ground effect”<br />
hover ceiling is usually higher than the “out of ground<br />
effect” hover ceiling because of the added lift benefit<br />
produced by ground effect.<br />
In Ground Effect (IGE) Hover—Hovering close to the surface (usually<br />
less than one rotor diameter above the surface) under the influence of<br />
ground effect.<br />
Out of Ground Effect (OGE) Hover—Hovering greater than one rotor<br />
diameter distance above the surface. Because induced drag is greater<br />
while hovering out of ground effect, it takes more power to achieve a<br />
hover. See Chapter 3—Aerodynamics of Flight for more details on IGE<br />
and OGE hover.<br />
8-3