Rotorcraft Flying Handbook, FAA-H-8083-21
Rotorcraft Flying Handbook, FAA-H-8083-21
Rotorcraft Flying Handbook, FAA-H-8083-21

Create successful ePaper yourself
Turn your PDF publications into a flip-book with our unique Google optimized e-Paper software.
the entire flight operation. Being able to hover at the takeoff<br />
location with a certain gross weight does not ensure the<br />
same performance at the landing point. If the destination<br />
point is at a higher density altitude because of higher elevation,<br />
temperature, and/or relative humidity, more power<br />
is required to hover. You should be able to predict whether<br />
hovering power will be available at the destination by<br />
knowing the temperature and wind conditions, using the<br />
performance charts in the helicopter flight manual, and<br />
making certain power checks during hover and in flight<br />
prior to commencing the approach and landing.<br />
TAKEOFF PERFORMANCE<br />
If takeoff charts are included in the rotorcraft flight manual,<br />
they usually indicate the distance it takes to clear a 50-<br />
foot obstacle based on various conditions of weight,<br />
pressure altitude, and temperature. In addition, the values<br />
computed in the takeoff charts usually assume that the<br />
flight profile is per the applicable height-velocity diagram.<br />
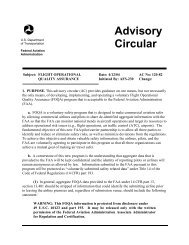
SAMPLE PROBLEM 3<br />
In this example, determine the distance to clear a 50-<br />
foot obstacle with the following conditions:<br />
Pressure Altitude..................................5,000 feet<br />
Takeoff Gross Weight.....................2,850 pounds<br />
Temperature .................................................95°F<br />
Using figure 8-4, locate 2,850 pounds in the first column.<br />
Since the pressure altitude of 5,000 feet is not one<br />
of the choices in column two, you have to interpolate<br />
between the values from the 4,000- and 6,000-foot<br />
lines. Follow each of these rows out to the column<br />
headed by 95°F. The values are 1,102 feet and 1,538<br />
feet. Since 5,000 is halfway between 4,000 and 6,000,<br />
the interpolated value should be halfway between these<br />
two values or 1,320 feet ([1,102 + 1,538] 4 2 = 1,320).<br />
CLIMB PERFORMANCE<br />
Most of the factors affecting hover and takeoff performance<br />
also affect climb performance. In addition,<br />
turbulent air, pilot techniques, and overall condition of<br />
the helicopter can cause climb performance to vary.<br />
A helicopter flown at the “best rate-of-climb” speed<br />
will obtain the greatest gain in altitude over a given<br />
period of time. This speed is normally used during the<br />
climb after all obstacles have been cleared and is usually<br />
maintained until reaching cruise altitude. Rate of<br />
climb must not be confused with angle of climb.<br />
Angle of climb is a function of altitude gained over a<br />
given distance. The best rate-of-climb speed results in<br />
the highest climb rate, but not the steepest climb angle<br />
and may not be sufficient to clear obstructions. The<br />
“best angle-of-climb” speed depends upon the power<br />
available. If there is a surplus of power available, the<br />
helicopter can climb vertically, so the best angle-ofclimb<br />
speed is zero.<br />
Wind direction and speed have an effect on climb performance,<br />
but it is often misunderstood. Airspeed is<br />
the speed at which the helicopter is moving through<br />
the atmosphere and is unaffected by wind.<br />
Atmospheric wind affects only the groundspeed, or<br />
speed at which the helicopter is moving over the<br />
earth’s surface. Thus, the only climb performance<br />
TAKE-OFF DISTANCE (FEET TO CLEAR 50 FOOT OBSTACLE)<br />
Gross<br />
Weight<br />
Pounds<br />
Pressure<br />
Altitude<br />
Feet<br />
At<br />
–13°F<br />
–25°C<br />
At<br />
23°F<br />
–5°C<br />
At<br />
59°F<br />
15°C<br />
At<br />
95°F<br />
35°C<br />
2,150<br />
SL<br />
2,000<br />
4,000<br />
6,000<br />
8,000<br />
373<br />
400<br />
428<br />
461<br />
567<br />
401<br />
434<br />
462<br />
510<br />
674<br />
430<br />
461<br />
494<br />
585<br />
779<br />
458<br />
491<br />
527<br />
677<br />
896<br />
2,500<br />
SL<br />
2,000<br />
4,000<br />
6,000<br />
8,000<br />
531<br />
568<br />
611<br />
654<br />
811<br />
569<br />
614<br />
660<br />
727<br />
975<br />
613<br />
660<br />
709<br />
848<br />
1,144<br />
652<br />
701<br />
759<br />
986<br />
1,355<br />
2,850<br />
SL<br />
2,000<br />
4,000<br />
6,000<br />
8,000<br />
743<br />
770<br />
861<br />
939<br />
1,201<br />
806<br />
876<br />
940<br />
1,064<br />
1,527<br />
864<br />
929<br />
929<br />
1,011<br />
1,017<br />
1,102<br />
1,255<br />
1,538<br />
– –<br />
1,320<br />
Figure 8-4. Takeoff Distance Chart.<br />
8-5