- Page 1 and 2:
Dit prospectus is gemaakt voor de u
- Page 3 and 4:
A Dutch language description of the
- Page 5:
FUND LINKED INTEREST NOTE PROVISION
- Page 8 and 9:
Where:SPX (0) means the Reference L
- Page 10 and 11:
(b)Whether the Notesrelate to a bas
- Page 12 and 13:
37. Instalment Notes: Not Applicabl
- Page 14 and 15:
PART B - OTHER INFORMATION1. LISTIN
- Page 16 and 17:
Index to track general stock market
- Page 18 and 19:
(b)(c)(d)(e)(f)Conditions to which
- Page 20 and 21:
ANNEXDUTCH LANGUAGE DESCRIPTIONNEDE
- Page 22 and 23:
OFFERING CIRCULARRABOBANK STRUCTURE
- Page 24 and 25:
ChapterTABLE OF CONTENTSPageSUMMARY
- Page 26 and 27:
Rabobank’s current long-term depo
- Page 28 and 29:
y the International Swaps and Deriv
- Page 30 and 31:
Delivery of the Deliverable Obligat
- Page 32 and 33:
RISK FACTORSThe Issuer believes tha
- Page 34 and 35:
Transfer limits are determined acco
- Page 36 and 37:
Effect of governmental policy and r
- Page 38 and 39:
Currency Linked NotesThe Issuer may
- Page 40 and 41:
Adjustment to the terms and conditi
- Page 42 and 43:
Prospective purchasers of the Notes
- Page 44 and 45:
Notes issued at a substantial disco
- Page 46 and 47:
implementation of the Savings Direc
- Page 48 and 49:
Legal investment considerations may
- Page 50 and 51:
IMPORTANT INFORMATIONThis Offering
- Page 52 and 53:
equirement to publish a prospectus
- Page 54 and 55:
Issuer or such directors and office
- Page 56 and 57:
FORM OF FINAL TERMS (LESS THAN EUR
- Page 58 and 59:
REPRESENTATION CAN BE MADE AS TO TH
- Page 60 and 61:
8. Maturity Date or Redemption Mont
- Page 62 and 63:
(i)Other terms relating to the meth
- Page 64 and 65:
Redemption Amounts and Late Payment
- Page 66 and 67:
INDEX LINKED INTEREST NOTE PROVISIO
- Page 68 and 69:
[[●]/See Schedule]](b)(c)(d)(e)Pa
- Page 70 and 71:
(Specify other)](f) Additional Fina
- Page 72 and 73:
(c) Day Count Fraction: [Actual/Act
- Page 74 and 75:
(c)Provisions for determining Final
- Page 76 and 77:
(e)Relevant provisions for determin
- Page 78 and 79:
[The obligation(s) identified as fo
- Page 80 and 81:
(x) Physical Settlement Period: [
- Page 82 and 83:
(j) Fund Business Day: [[●] (Give
- Page 84 and 85:
DISTRIBUTION45. (a) If syndicated,
- Page 86 and 87:
PART B - OTHER INFORMATION 71. LIST
- Page 88 and 89:
composed by the Issuer and if the i
- Page 90 and 91:
(When completing this paragraph, co
- Page 92 and 93:
(h)(i)(j)(k)(l)[Procedure for exerc
- Page 94 and 95:
FORM OF FINAL TERMS (AT LEAST EUR 5
- Page 96 and 97:
(When adding any other terms, risk
- Page 98 and 99:
[Fund Linked Redemption]/[Dual Curr
- Page 100 and 101:
(f) Screen Rate Determination: [App
- Page 102 and 103:
(e)Currencies and/or formula isimpo
- Page 104 and 105:
(d)Provisions for determining theRa
- Page 106 and 107:
(f) Additional Disruption Events: [
- Page 108 and 109:
(j)Others terms or specialcondition
- Page 110 and 111:
[Actual/Actual (ISDA)]/[Other](d) O
- Page 112 and 113:
INDEX LINKED REDEMPTION NOTE PROVIS
- Page 114 and 115:
(g) Observation Date(s): [[●] (Gi
- Page 116 and 117:
Obligations:[The obligation(s) iden
- Page 118 and 119:
Terms relating to PhysicalDelivery:
- Page 120 and 121:
(vi) Benchmark Change: The benchmar
- Page 122 and 123:
(When adding any other final terms,
- Page 124 and 125:
PART B - OTHER INFORMATION 121. LIS
- Page 126 and 127:
information about the index can be
- Page 128 and 129:
(Include other information concerni
- Page 130 and 131:
SCHEDULE [●] TO THE FINAL TERMS(I
- Page 132 and 133:
Terms and Conditions for the purpos
- Page 134 and 135:
Day Count Fraction =[360 x (Y2 - Y
- Page 136 and 137:
“Delivery Agent”“Determinatio
- Page 138 and 139:
and/or of DTC, as applicable, as th
- Page 140 and 141:
Bearer Notes are represented either
- Page 142 and 143:
writing, be mailed by uninsured pos
- Page 144 and 145:
(b)Interest on Floating Rate Notes,
- Page 146 and 147:
The Agency Agreement contains provi
- Page 148 and 149:
(d)Interest on Dual Currency NotesI
- Page 150 and 151:
In the case of a partial redemption
- Page 152 and 153:
Where such calculation is made for
- Page 154 and 155:
Redemption Amount and/or the Strike
- Page 156 and 157:
(irrespective of whether that eight
- Page 158 and 159:
price risk of the Issuer issuing an
- Page 160 and 161:
espect of a Multi-Exchange Index ex
- Page 162 and 163:
exchange or quotation system as on
- Page 164 and 165:
8. Equity Linked Notes(a)Redemption
- Page 166 and 167:
e appropriate to preserve the econo
- Page 168 and 169:
case, such date of delivery shall b
- Page 170 and 171:
Equity Issuer or Underlying Equity
- Page 172 and 173:
For the avoidance of doubt, where a
- Page 174 and 175:
(vii)If the Calculation Agent deter
- Page 176 and 177:
(C)“Valid Date” shall mean a Sc
- Page 178 and 179:
effect transactions in, or obtain m
- Page 180 and 181:
occurrence of a Disrupted Day shall
- Page 182 and 183:
Calculation Agent) on the overall m
- Page 184 and 185:
9. Fund Linked Notes(a)Redemption o
- Page 186 and 187:
(x)(xi)(xii)any material change or
- Page 188 and 189:
elevant Final Terms) or its equival
- Page 190 and 191:
(c)Disrupted Days(i)Valuation Dates
- Page 192 and 193:
“FundAdministrator”“Fund Advi
- Page 194 and 195:
(b)Cash SettlementIf Cash Settlemen
- Page 196 and 197:
no further or other amount in respe
- Page 198 and 199:
Notice, the relevant Noteholder may
- Page 200 and 201:
the same highest or lowest value, t
- Page 202 and 203:
method or if such Obligation’s yi
- Page 204 and 205:
“Best AvailableInformation”mean
- Page 206 and 207:
(ii)(iii)where “Grace Period Exte
- Page 208 and 209:
“Deliverable Obligation”means,
- Page 210 and 211:
Obligation may be included as a Del
- Page 212 and 213:
“Assignable Loan”, “Consent R
- Page 214 and 215:
whose outstanding Voting Shares are
- Page 216 and 217:
Obligation”“Governmental Author
- Page 218 and 219:
Entity consolidates or amalgamates
- Page 220 and 221:
aforementioned currencies, which cu
- Page 222 and 223:
Default Requirement have become due
- Page 224 and 225:
Issuer a certificate signed by a Ma
- Page 226 and 227:
Quotations shall include or exclude
- Page 228 and 229:
effective.“Restructured Bond orLo
- Page 230 and 231:
Deliverable Obligation Characterist
- Page 232 and 233:
change in the Reference Obligation
- Page 234 and 235:
Derivatives Definitions.Upon the Ca
- Page 236 and 237: (ii)The following Valuation Methods
- Page 238 and 239: (l)Provisions relating to Multiple
- Page 240 and 241: (d)Payments in respect of Registere
- Page 242 and 243: 12. TaxationAll payments of princip
- Page 244 and 245: 15. AgentsThe Issuing and Paying Ag
- Page 246 and 247: The Agency Agreement may be amended
- Page 248 and 249: the first payment of interest there
- Page 250 and 251: FORM OF THE NOTESInitial Issue of N
- Page 252 and 253: procure the delivery of, a Permanen
- Page 254 and 255: −Notices. So long as any Notes ar
- Page 256 and 257: CLEARING AND SETTLEMENTBook-Entry O
- Page 258 and 259: Euroclear and Clearstream customers
- Page 260 and 261: 59.1 per cent., and the return on e
- Page 262 and 263: agricultural market. Structured Fin
- Page 264 and 265: Real estate, Rabo Vastgoedgroep N.V
- Page 266 and 267: and that Rabobank Group’s broad r
- Page 268 and 269: Leveraging Rabobank’s distributio
- Page 270 and 271: RABOBANK GROUP STRUCTURECoöperatie
- Page 272 and 273: Rabobank Nederland’s “central b
- Page 274 and 275: continue. Management expects that t
- Page 276 and 277: footnotes to the audited consolidat
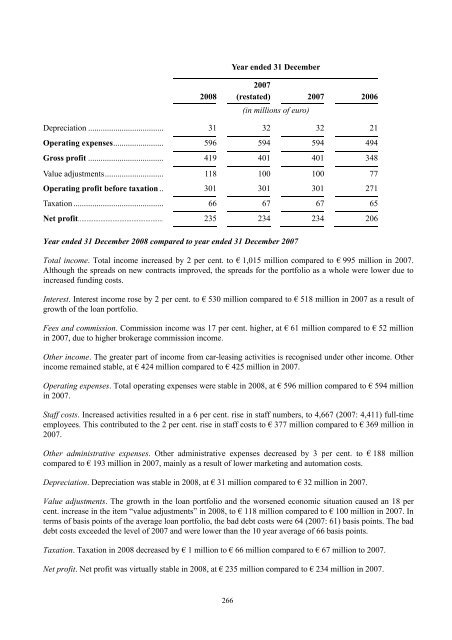
- Page 278 and 279: Operating expenses. Total operating
- Page 280 and 281: Year ended 31 December20082007(rest
- Page 282 and 283: Year ended 31 December20082007(rest
- Page 284 and 285: Other income. Other income decrease
- Page 288 and 289: Year ended 31 December 2007 compare
- Page 290 and 291: Year ended 31 December 2007 compare
- Page 292 and 293: Year ended 31 December20082007*(res
- Page 294 and 295: Contingent liabilities relate prima
- Page 296 and 297: The BIS ratio is calculated by divi
- Page 298 and 299: The table below sets forth a geogra
- Page 300 and 301: (in millions of euro)BanksPublicaut
- Page 302 and 303: The following table provides an ana
- Page 304 and 305: At 31 December(in millions of euro)
- Page 306 and 307: (in millions of euro) 30-Jun-09 31-
- Page 308 and 309: RISK MANAGEMENTRabobank Group place
- Page 310 and 311: Credit riskRabobank Group aims to o
- Page 312 and 313: Liquidity risk is an organisation-w
- Page 314 and 315: Supervisory BoardThe Supervisory Bo
- Page 316 and 317: increasing legislation and regulati
- Page 318 and 319: Supervisory Board of Rabobank Neder
- Page 320 and 321: Auxiliary positionsDate of first ap
- Page 322 and 323: Date of first appointment tothe Sup
- Page 324 and 325: Date of first appointment tothe Sup
- Page 326 and 327: Supervision & Monetary Affairs and
- Page 328 and 329: REGULATION OF RABOBANK GROUPRaboban
- Page 330 and 331: Dutch regulationGeneralAs of Septem
- Page 332 and 333: EmergenciesThe Financial Supervisio
- Page 334 and 335: TAXATIONGeneralThe following summar
- Page 336 and 337:
to dispose of the Notes. In some ca
- Page 338 and 339:
settlement institution and pays the
- Page 340 and 341:
their own professional advisers as
- Page 342 and 343:
should consult their tax adviser co
- Page 344 and 345:
espect to the Discount Note for eac
- Page 346 and 347:
(c) it does not provide for any pri
- Page 348 and 349:
U.S. federal income tax purposes) h
- Page 350 and 351:
Contingent NotesGain from the sale
- Page 352 and 353:
issue price of a Foreign Currency C
- Page 354 and 355:
4.3 U.S. Federal Income Tax Treatme
- Page 356 and 357:
Issuers intend to treat the Forward
- Page 358 and 359:
Retirement of an Option Note for Ca
- Page 360 and 361:
U.S. Holder will be required to dis
- Page 362 and 363:
‘“benefit plan investors”.
- Page 364 and 365:
(7) Distribution of this Offering C
- Page 366 and 367:
(d)(e)at any time to fewer than 100
- Page 368 and 369:
for the purposes of its business an
- Page 370 and 371:
e-offering or resale, directly or i
- Page 372 and 373:
GENERAL INFORMATION1. Application h
- Page 374:
PRINCIPAL OFFICE OF THE ISSUERCoöp