Master Thesis - Hochschule Bonn-Rhein-Sieg
Master Thesis - Hochschule Bonn-Rhein-Sieg
Master Thesis - Hochschule Bonn-Rhein-Sieg

Create successful ePaper yourself
Turn your PDF publications into a flip-book with our unique Google optimized e-Paper software.
4. Overall evading concept <strong>Master</strong> <strong>Thesis</strong> Björn Ostermann page 38 of 126<br />
The performance of the program must be known, in order to compute the necessary safety distance the<br />
robot has to keep from the operator (see chapter 6.3). For measuring the performance of the single<br />
parts of the program it is necessary to acquire the time a single loop takes to compute. Thus, at the<br />
beginning of each loop the current processor time is taken and compared to the time of the last loop.<br />
This allows for an estimation of the frames that are handled in a certain amount of time.<br />
The number of frames handled per second changes within a small range between two loops. Thus, in<br />
order to avoid problems in the depiction of the value, it is not continuously transferred to the thread of<br />
the GUI, but is acquired by the GUI if the user pushes the respective button (“Get FPS” – Frames Per<br />
Second) and displayed alongside the button. Also this has the advantage that the value can be better<br />
taken during specific situations.<br />
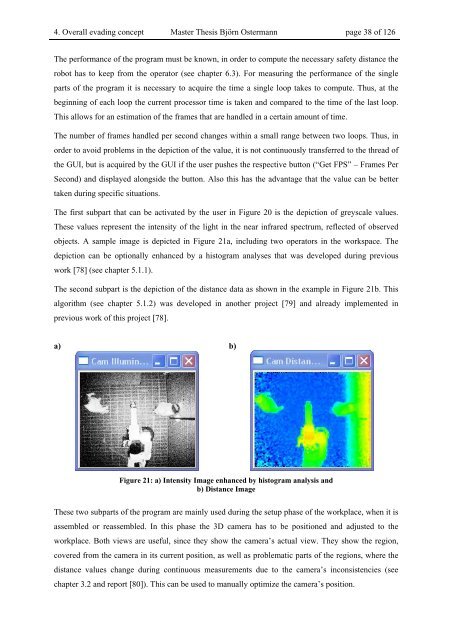
The first subpart that can be activated by the user in Figure 20 is the depiction of greyscale values.<br />
These values represent the intensity of the light in the near infrared spectrum, reflected of observed<br />
objects. A sample image is depicted in Figure 21a, including two operators in the workspace. The<br />
depiction can be optionally enhanced by a histogram analyses that was developed during previous<br />
work [78] (see chapter 5.1.1).<br />
The second subpart is the depiction of the distance data as shown in the example in Figure 21b. This<br />
algorithm (see chapter 5.1.2) was developed in another project [79] and already implemented in<br />
previous work of this project [78].<br />
a) b)<br />
Figure 21: a) Intensity Image enhanced by histogram analysis and<br />
b) Distance Image<br />
These two subparts of the program are mainly used during the setup phase of the workplace, when it is<br />
assembled or reassembled. In this phase the 3D camera has to be positioned and adjusted to the<br />
workplace. Both views are useful, since they show the camera’s actual view. They show the region,<br />
covered from the camera in its current position, as well as problematic parts of the regions, where the<br />
distance values change during continuous measurements due to the camera’s inconsistencies (see<br />
chapter 3.2 and report [80]). This can be used to manually optimize the camera’s position.