airVision User Guide - Ubiquiti Networks
airVision User Guide - Ubiquiti Networks
airVision User Guide - Ubiquiti Networks

You also want an ePaper? Increase the reach of your titles
YUMPU automatically turns print PDFs into web optimized ePapers that Google loves.
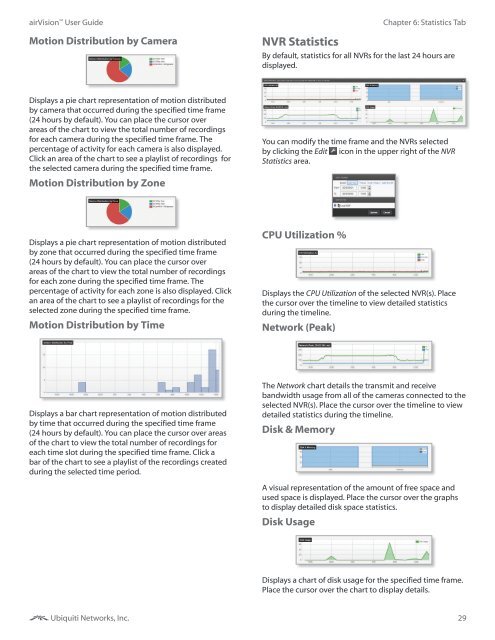
<strong>airVision</strong> <strong>User</strong> <strong>Guide</strong>Motion Distribution by CameraNVR StatisticsChapter 6: Statistics TabBy default, statistics for all NVRs for the last 24 hours aredisplayed.Displays a pie chart representation of motion distributedby camera that occurred during the specified time frame(24 hours by default). You can place the cursor overareas of the chart to view the total number of recordingsfor each camera during the specified time frame. Thepercentage of activity for each camera is also displayed.Click an area of the chart to see a playlist of recordings forthe selected camera during the specified time frame.Motion Distribution by ZoneYou can modify the time frame and the NVRs selectedby clicking the Edit icon in the upper right of the NVRStatistics area.Displays a pie chart representation of motion distributedby zone that occurred during the specified time frame(24 hours by default). You can place the cursor overareas of the chart to view the total number of recordingsfor each zone during the specified time frame. Thepercentage of activity for each zone is also displayed. Clickan area of the chart to see a playlist of recordings for theselected zone during the specified time frame.Motion Distribution by TimeCPU Utilization %Displays the CPU Utilization of the selected NVR(s). Placethe cursor over the timeline to view detailed statisticsduring the timeline.Network (Peak)Displays a bar chart representation of motion distributedby time that occurred during the specified time frame(24 hours by default). You can place the cursor over areasof the chart to view the total number of recordings foreach time slot during the specified time frame. Click abar of the chart to see a playlist of the recordings createdduring the selected time period.The Network chart details the transmit and receivebandwidth usage from all of the cameras connected to theselected NVR(s). Place the cursor over the timeline to viewdetailed statistics during the timeline.Disk & MemoryA visual representation of the amount of free space andused space is displayed. Place the cursor over the graphsto display detailed disk space statistics.Disk UsageDisplays a chart of disk usage for the specified time frame.Place the cursor over the chart to display details.<strong>Ubiquiti</strong> <strong>Networks</strong>, Inc.29