

Saudi Petrochemicals - NCBC
Saudi Petrochemicals - NCBC
Saudi Petrochemicals - NCBC

You also want an ePaper? Increase the reach of your titles
YUMPU automatically turns print PDFs into web optimized ePapers that Google loves.
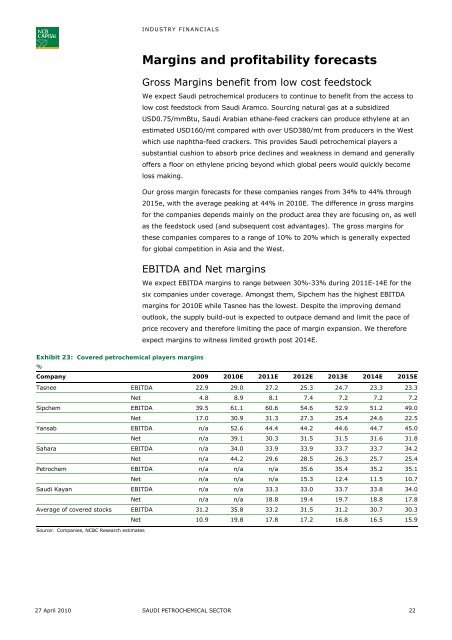
INDUSTRY FINANCIALSMargins and profitability forecastsGross Margins benefit from low cost feedstockWe expect <strong>Saudi</strong> petrochemical producers to continue to benefit from the access tolow cost feedstock from <strong>Saudi</strong> Aramco. Sourcing natural gas at a subsidizedUSD0.75/mmBtu, <strong>Saudi</strong> Arabian ethane-feed crackers can produce ethylene at anestimated USD160/mt compared with over USD380/mt from producers in the Westwhich use naphtha-feed crackers. This provides <strong>Saudi</strong> petrochemical players asubstantial cushion to absorb price declines and weakness in demand and generallyoffers a floor on ethylene pricing beyond which global peers would quickly becomeloss making.Our gross margin forecasts for these companies ranges from 34% to 44% through2015e, with the average peaking at 44% in 2010E. The difference in gross marginsfor the companies depends mainly on the product area they are focusing on, as wellas the feedstock used (and subsequent cost advantages). The gross margins forthese companies compares to a range of 10% to 20% which is generally expectedfor global competition in Asia and the West.EBITDA and Net marginsWe expect EBITDA margins to range between 30%-33% during 2011E-14E for thesix companies under coverage. Amongst them, Sipchem has the highest EBITDAmargins for 2010E while Tasnee has the lowest. Despite the improving demandoutlook, the supply build-out is expected to outpace demand and limit the pace ofprice recovery and therefore limiting the pace of margin expansion. We thereforeexpect margins to witness limited growth post 2014E.Exhibit 23: Covered petrochemical players margins%Company 2009 2010E 2011E 2012E 2013E 2014E 2015ETasnee EBITDA 22.9 29.0 27.2 25.3 24.7 23.3 23.3Net 4.8 8.9 8.1 7.4 7.2 7.2 7.2Sipchem EBITDA 39.5 61.1 60.6 54.6 52.9 51.2 49.0Net 17.0 30.9 31.3 27.3 25.4 24.6 22.5Yansab EBITDA n/a 52.6 44.4 44.2 44.6 44.7 45.0Net n/a 39.1 30.3 31.5 31.5 31.6 31.8Sahara EBITDA n/a 34.0 33.9 33.9 33.7 33.7 34.2Net n/a 44.2 29.6 28.5 26.3 25.7 25.4Petrochem EBITDA n/a n/a n/a 35.6 35.4 35.2 35.1Net n/a n/a n/a 15.3 12.4 11.5 10.7<strong>Saudi</strong> Kayan EBITDA n/a n/a 33.3 33.0 33.7 33.8 34.0Net n/a n/a 18.8 19.4 19.7 18.8 17.8Average of covered stocks EBITDA 31.2 35.8 33.2 31.5 31.2 30.7 30.3Net 10.9 19.8 17.8 17.2 16.8 16.5 15.9Source: Companies, <strong>NCBC</strong> Research estimates27 April 2010 SAUDI PETROCHEMICAL SECTOR 22


