

Saudi Petrochemicals - NCBC
Saudi Petrochemicals - NCBC
Saudi Petrochemicals - NCBC

You also want an ePaper? Increase the reach of your titles
YUMPU automatically turns print PDFs into web optimized ePapers that Google loves.
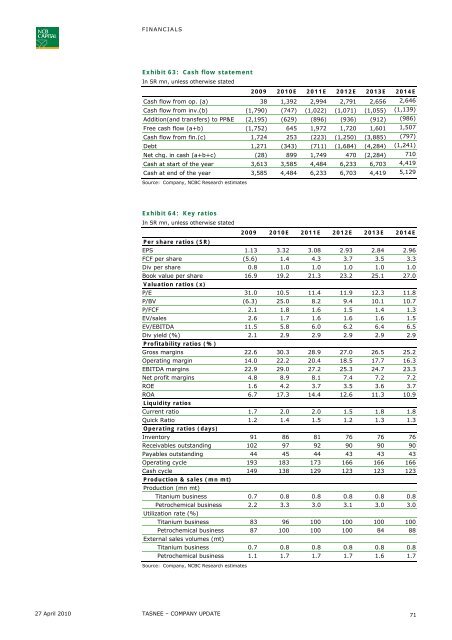
FINANCIALSExhibit 63: Cash flow statementIn SR mn, unless otherwise stated2009 2010E 2011E 2012E 2013E 2014ECash flow from op. (a) 38 1,392 2,994 2,791 2,656 2,646Cash flow from inv.(b) (1,790) (747) (1,022) (1,071) (1,055) (1,139)Addition(and transfers) to PP&E (2,195) (629) (896) (936) (912) (986)Free cash flow (a+b) (1,752) 645 1,972 1,720 1,601 1,507Cash flow from fin.(c) 1,724 253 (223) (1,250) (3,885) (797)Debt 1,271 (343) (711) (1,684) (4,284) (1,241)Net chg. in cash (a+b+c) (28) 899 1,749 470 (2,284) 710Cash at start of the year 3,613 3,585 4,484 6,233 6,703 4,419Cash at end of the year 3,585 4,484 6,233 6,703 4,419 5,129Source: Company, <strong>NCBC</strong> Research estimatesExhibit 64: Key ratiosIn SR mn, unless otherwise stated2009 2010E 2011E 2012E 2013E 2014EPer share ratios (SR)EPS 1.13 3.32 3.08 2.93 2.84 2.96FCF per share (5.6) 1.4 4.3 3.7 3.5 3.3Div per share 0.8 1.0 1.0 1.0 1.0 1.0Book value per share 16.9 19.2 21.3 23.2 25.1 27.0Valuation ratios (x)P/E 31.0 10.5 11.4 11.9 12.3 11.8P/BV (6.3) 25.0 8.2 9.4 10.1 10.7P/FCF 2.1 1.8 1.6 1.5 1.4 1.3EV/sales 2.6 1.7 1.6 1.6 1.6 1.5EV/EBITDA 11.5 5.8 6.0 6.2 6.4 6.5Div yield (%) 2.1 2.9 2.9 2.9 2.9 2.9Profitability ratios (%)Gross margins 22.6 30.3 28.9 27.0 26.5 25.2Operating margin 14.0 22.2 20.4 18.5 17.7 16.3EBITDA margins 22.9 29.0 27.2 25.3 24.7 23.3Net profit margins 4.8 8.9 8.1 7.4 7.2 7.2ROE 1.6 4.2 3.7 3.5 3.6 3.7ROA 6.7 17.3 14.4 12.6 11.3 10.9Liquidity ratiosCurrent ratio 1.7 2.0 2.0 1.5 1.8 1.8Quick Ratio 1.2 1.4 1.5 1.2 1.3 1.3Operating ratios (days)Inventory 91 86 81 76 76 76Receivables outstanding 102 97 92 90 90 90Payables outstanding 44 45 44 43 43 43Operating cycle 193 183 173 166 166 166Cash cycle 149 138 129 123 123 123Production & sales (mn mt)Production (mn mt)Titanium business 0.7 0.8 0.8 0.8 0.8 0.8Petrochemical business 2.2 3.3 3.0 3.1 3.0 3.0Utilization rate (%)Titanium business 83 96 100 100 100 100Petrochemical business 87 100 100 100 84 88External sales volumes (mt)Titanium business 0.7 0.8 0.8 0.8 0.8 0.8Petrochemical business 1.1 1.7 1.7 1.7 1.6 1.7Source: Company, <strong>NCBC</strong> Research estimates27 April 2010 TASNEE – COMPANY UPDATE71


