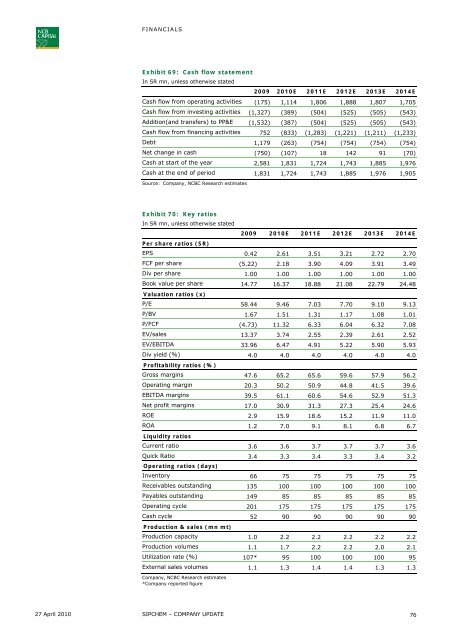
FINANCIALSExhibit 69: Cash flow statementIn SR mn, unless otherwise stated2009 2010E 2011E 2012E 2013E 2014ECash flow from operating activities (175) 1,114 1,806 1,888 1,807 1,705Cash flow from investing activities (1,327) (389) (504) (525) (505) (543)Addition(and transfers) to PP&E (1,532) (387) (504) (525) (505) (543)Cash flow from financing activities 752 (833) (1,283) (1,221) (1,211) (1,233)Debt 1,179 (263) (754) (754) (754) (754)Net change in cash (750) (107) 18 142 91 (70)Cash at start of the year 2,581 1,831 1,724 1,743 1,885 1,976Cash at the end of period 1,831 1,724 1,743 1,885 1,976 1,905Source: Company, <strong>NCBC</strong> Research estimatesExhibit 70: Key ratiosIn SR mn, unless otherwise stated2009 2010E 2011E 2012E 2013E 2014EPer share ratios (SR)EPS 0.42 2.61 3.51 3.21 2.72 2.70FCF per share (5.22) 2.18 3.90 4.09 3.91 3.49Div per share 1.00 1.00 1.00 1.00 1.00 1.00Book value per share 14.77 16.37 18.88 21.08 22.79 24.48Valuation ratios (x)P/E 58.44 9.46 7.03 7.70 9.10 9.13P/BV 1.67 1.51 1.31 1.17 1.08 1.01P/FCF (4.73) 11.32 6.33 6.04 6.32 7.08EV/sales 13.37 3.74 2.55 2.39 2.61 2.52EV/EBITDA 33.96 6.47 4.91 5.22 5.90 5.93Div yield (%) 4.0 4.0 4.0 4.0 4.0 4.0Profitability ratios (%)Gross margins 47.6 65.2 65.6 59.6 57.9 56.2Operating margin 20.3 50.2 50.9 44.8 41.5 39.6EBITDA margins 39.5 61.1 60.6 54.6 52.9 51.3Net profit margins 17.0 30.9 31.3 27.3 25.4 24.6ROE 2.9 15.9 18.6 15.2 11.9 11.0ROA 1.2 7.0 9.1 8.1 6.8 6.7Liquidity ratiosCurrent ratio 3.6 3.6 3.7 3.7 3.7 3.6Quick Ratio 3.4 3.3 3.4 3.3 3.4 3.2Operating ratios (days)Inventory 66 75 75 75 75 75Receivables outstanding 135 100 100 100 100 100Payables outstanding 149 85 85 85 85 85Operating cycle 201 175 175 175 175 175Cash cycle 52 90 90 90 90 90Production & sales (mn mt)Production capacity 1.0 2.2 2.2 2.2 2.2 2.2Production volumes 1.1 1.7 2.2 2.2 2.0 2.1Utilization rate (%) 107* 95 100 100 100 95External sales volumes 1.1 1.3 1.4 1.4 1.3 1.3Company, <strong>NCBC</strong> Research estimates*Company reported figure27 April 2010 SIPCHEM – COMPANY UPDATE76
Kindly send all mailing list requests to research@ncbc.comHead of Research Eiji Aono e.aono@ncbc.com +966 2 690 7786Brokerage websitewww.alahlitadawul.com / www.alahlibrokerage.comCorporate websitewww.ncbc.com<strong>NCBC</strong> INVESTMENT RATINGSOverweight:Neutral:Underweight:Price Target:Target price represents expected returns in excess of 15% in the next 12 monthsTarget price represents expected returns between -10% and +15% in the next 12 monthsTarget price represents a fall in share price exceeding 10% in the next 12 monthsAnalysts set share price targets for individual companies based on a 12 month horizon. These share pricetargets are subject to a range of company specific and market risks. Target prices are based on a methodologychosen by the analyst as the best predictor of the share price over the 12 month horizonOTHER DEFINITIONSNR:CS:NC:Not Rated. The investment rating has been suspended temporarily. Such suspension is in compliance withapplicable regulations and/or in circumstances when NCB Capital is acting in an advisory capacity in a merger orstrategic transaction involving the company and in certain other situationsCoverage Suspended. <strong>NCBC</strong> has suspended coverage of this companyNot Covered. <strong>NCBC</strong> does not cover this companyIMPORTANT INFORMATIONThe authors of this document hereby certify that the views expressed in this document accurately reflect their personal views regarding thesecurities and companies that are the subject of this document. The authors also certify that neither they nor their respective spouses ordependants (if relevant) hold a beneficial interest in the securities that are the subject of this document. Funds managed by NCB Capital andits subsidiaries for third parties may own the securities that are the subject of this document. NCB Capital or its subsidiaries may ownsecurities in one or more of the aforementioned companies, or funds or in funds managed by third parties The authors of this document mayown securities in funds open to the public that invest in the securities mentioned in this document as part of a diversified portfolio over whichthey have no discretion. The Investment Banking division of NCB Capital may be in the process of soliciting or executing fee earningmandates for companies that are either the subject of this document or are mentioned in this document.This document is issued to the person to whom NCB Capital has issued it. This document is intended for general information purposes only,and may not be reproduced or redistributed to any other person. This document is not intended as an offer or solicitation with respect to thepurchase or sale of any security. This document is not intended to take into account any investment suitability needs of the recipient. Inparticular, this document is not customized to the specific investment objectives, financial situation, risk appetite or other needs of anyperson who may receive this document. NCB Capital strongly advises every potential investor to seek professional legal, accounting andfinancial guidance when determining whether an investment in a security is appropriate to his or her needs. Any investmentrecommendations contained in this document take into account both risk and expected return. Information and opinions contained in thisdocument have been compiled or arrived at by NCB Capital from sources believed to be reliable, but NCB Capital has not independentlyverified the contents of this document and such information may be condensed or incomplete. Accordingly, no representation or warranty,express or implied, is made as to, and no reliance should be placed on the fairness, accuracy, completeness or correctness of the informationand opinions contained in this document. To the maximum extent permitted by applicable law and regulation, NCB Capital shall not be liablefor any loss that may arise from the use of this document or its contents or otherwise arising in connection therewith. Any financialprojections, fair value estimates and statements regarding future prospects contained in this document may not be realized. All opinions andestimates included in this document constitute NCB Capital’s judgment as of the date of production of this document, and are subject tochange without notice. Past performance of any investment is not indicative of future results. The value of securities, the income from them,the prices and currencies of securities, can go down as well as up. An investor may get back less than he or she originally invested.Additionally, fees may apply on investments in securities. Changes in currency rates may have an adverse effect on the value, price orincome of a security. No part of this document may be reproduced without the written permission of NCB Capital. Neither this document norany copy hereof may be distributed in any jurisdiction outside the Kingdom of <strong>Saudi</strong> Arabia where its distribution may be restricted by law.Persons who receive this document should make themselves aware, of and adhere to, any such restrictions. By accepting this document, therecipient agrees to be bound by the foregoing limitations.NCB Capital is authorised by the Capital Market Authority of the Kingdom of <strong>Saudi</strong> Arabia to carry out dealing, as principal and agent, andunderwriting, managing, arranging, advising and custody, with respect to securities under licence number 37-06046. NCB Capital’sregistered office is at 3rd & 4th Floor Tower B, NCB Regional Building, Al Mather street, P.O. Box 22216, Riyadh 11495, Kingdom of <strong>Saudi</strong>Arabia.27 April 2010 SAUDI PETROCHEMICAL SECTOR