

Saudi Petrochemicals - NCBC
Saudi Petrochemicals - NCBC
Saudi Petrochemicals - NCBC

You also want an ePaper? Increase the reach of your titles
YUMPU automatically turns print PDFs into web optimized ePapers that Google loves.
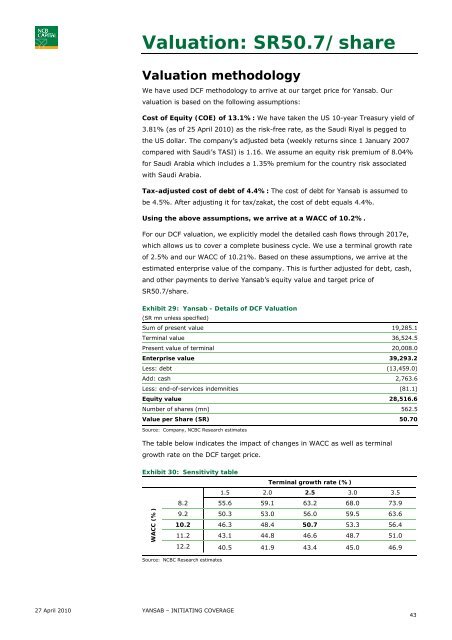
Valuation: SR50.7/shareValuation methodologyWe have used DCF methodology to arrive at our target price for Yansab. Ourvaluation is based on the following assumptions:Cost of Equity (COE) of 13.1%: We have taken the US 10-year Treasury yield of3.81% (as of 25 April 2010) as the risk-free rate, as the <strong>Saudi</strong> Riyal is pegged tothe US dollar. The company’s adjusted beta (weekly returns since 1 January 2007compared with <strong>Saudi</strong>’s TASI) is 1.16. We assume an equity risk premium of 8.04%for <strong>Saudi</strong> Arabia which includes a 1.35% premium for the country risk associatedwith <strong>Saudi</strong> Arabia.Tax-adjusted cost of debt of 4.4%: The cost of debt for Yansab is assumed tobe 4.5%. After adjusting it for tax/zakat, the cost of debt equals 4.4%.Using the above assumptions, we arrive at a WACC of 10.2%.For our DCF valuation, we explicitly model the detailed cash flows through 2017e,which allows us to cover a complete business cycle. We use a terminal growth rateof 2.5% and our WACC of 10.21%. Based on these assumptions, we arrive at theestimated enterprise value of the company. This is further adjusted for debt, cash,and other payments to derive Yansab’s equity value and target price ofSR50.7/share.Exhibit 29: Yansab - Details of DCF Valuation(SR mn unless specified)Sum of present value 19,285.1Terminal value 36,524.5Present value of terminal 20,008.0Enterprise value 39,293.2Less: debt (13,459.0)Add: cash 2,763.6Less: end-of-services indemnities (81.1)Equity value 28,516.6Number of shares (mn) 562.5Value per Share (SR) 50.70Source: Company, <strong>NCBC</strong> Research estimatesThe table below indicates the impact of changes in WACC as well as terminalgrowth rate on the DCF target price.Exhibit 30: Sensitivity tableTerminal growth rate (%)1.5 2.0 2.5 3.0 3.58.2 55.6 59.1 63.2 68.0 73.9WACC (%)9.2 50.3 53.0 56.0 59.5 63.610.2 46.3 48.4 50.7 53.3 56.411.2 43.1 44.8 46.6 48.7 51.012.2 40.5 41.9 43.4 45.0 46.9Source: <strong>NCBC</strong> Research estimates27 April 2010 YANSAB – INITIATING COVERAGE43


