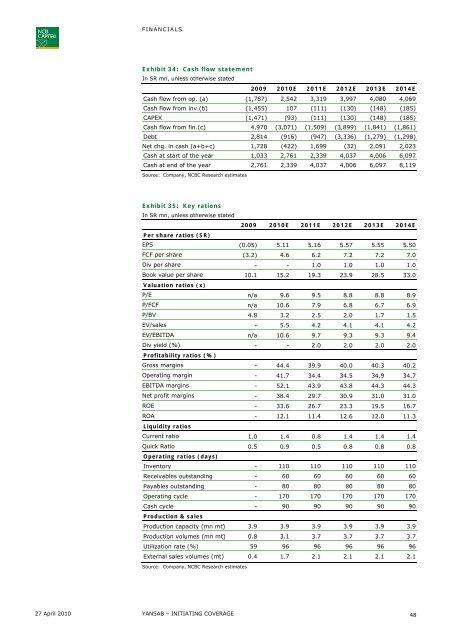
FINANCIALSExhibit 34: Cash flow statementIn SR mn, unless otherwise stated2009 2010E 2011E 2012E 2013E 2014ECash flow from op. (a) (1,787) 2,542 3,319 3,997 4,080 4,069Cash flow from inv.(b) (1,455) 107 (111) (130) (148) (185)CAPEX (1,471) (93) (111) (130) (148) (185)Cash flow from fin.(c) 4,970 (3,071) (1,509) (3,899) (1,841) (1,861)Debt 2,814 (916) (947) (3,336) (1,279) (1,298)Net chg. in cash (a+b+c) 1,728 (422) 1,699 (32) 2,091 2,023Cash at start of the year 1,033 2,761 2,339 4,037 4,006 6,097Cash at end of the year 2,761 2,339 4,037 4,006 6,097 8,119Source: Company, <strong>NCBC</strong> Research estimatesExhibit 35: Key rationsIn SR mn, unless otherwise stated2009 2010E 2011E 2012E 2013E 2014EPer share ratios (SR)EPS (0.05) 5.11 5.16 5.57 5.55 5.50FCF per share (3.2) 4.6 6.2 7.2 7.2 7.0Div per share - - 1.0 1.0 1.0 1.0Book value per share 10.1 15.2 19.3 23.9 28.5 33.0Valuation ratios (x)P/E n/a 9.6 9.5 8.8 8.8 8.9P/FCF n/a 10.6 7.9 6.8 6.7 6.9P/BV 4.8 3.2 2.5 2.0 1.7 1.5EV/sales - 5.5 4.2 4.1 4.1 4.2EV/EBITDA n/a 10.6 9.7 9.3 9.3 9.4Div yield (%) - - 2.0 2.0 2.0 2.0Profitability ratios (%)Gross margins - 44.4 39.9 40.0 40.3 40.2Operating margin - 41.7 34.4 34.5 34.9 34.7EBITDA margins - 52.1 43.9 43.8 44.3 44.3Net profit margins - 38.4 29.7 30.9 31.0 31.0ROE - 33.6 26.7 23.3 19.5 16.7ROA - 12.1 11.4 12.6 12.0 11.3Liquidity ratiosCurrent ratio 1.0 1.4 0.8 1.4 1.4 1.4Quick Ratio 0.5 0.9 0.5 0.8 0.8 0.8Operating ratios (days)Inventory - 110 110 110 110 110Receivables outstanding - 60 60 60 60 60Payables outstanding - 80 80 80 80 80Operating cycle - 170 170 170 170 170Cash cycle - 90 90 90 90 90Production & salesProduction capacity (mn mt) 3.9 3.9 3.9 3.9 3.9 3.9Production volumes (mn mt) 0.8 3.1 3.7 3.7 3.7 3.7Utilization rate (%) 59 96 96 96 96 96External sales volumes (mt) 0.4 1.7 2.1 2.1 2.1 2.1Source: Company, <strong>NCBC</strong> Research estimates27 April 2010 YANSAB – INITIATING COVERAGE48
PETROCHEMICAL | 27 April 2010INITIATION OF COVERAGE<strong>Saudi</strong> KayanNeutralTarget Price (SR) 20.3Current price (SR) 22.4Potential downside (%) ↓ 9.2Stock details52-week range H/L (SR) 23/11Market cap ($mn) 8,972Shares outstanding (mn) 1,500Listed on exchanges TADAWULPrice perf (%) 1M 3M 12MAbsolute 17.9 20.4 100.9Rel. to market 16.6 10.3 74.2Avg daily T/o (mn) SR US$3M 313.3 83.712M 214.4 57.2Reuters code2350.SEBloomberg code KAYAN ABWebsite www.saudikayan.comValuation multiples09 10E 11EP/E (x) - - 14.7P/B (x) 2.2 2.2 1.9EV/EBITDA (x) - - 12.4Div yield (%) - - -Source: <strong>NCBC</strong> Research estimatesShare price performance258000207000156000105500004000Apr-09 Sep-09 Mar-10KayanTASI (RHS)Still Awaiting Start of Operations<strong>Saudi</strong> Kayan Petrochemical Company’s (<strong>Saudi</strong> Kayan) diversifiedproduct mix and strong links with SABIC are key positives. However,doubts over on-time start of operations and a lack of revenues until2011e dim the near term outlook. We, therefore, initiate coverage on<strong>Saudi</strong> Kayan with a Neutral rating and target price of SR20.3/share.• Uncertainty on start of operations: <strong>Saudi</strong> Kayan’s initial target was that allplants would begin trial operations by the end of 2009. Despite this targetbeing reiterated in June 2009, shortly thereafter, in Dec. 2009, the companyannounced a delay until 2H 2010 for all plants (except LDPE and Amines whichwere expected to start in 2H 2012). In our forecasts we assume thatcommercial operations of the majority of plants will be delayed until 2Q 2011and the LDPE and Amines plants will delayed until 2013.• Strong earnings growth during 2011e-2013e: Given that we expectoperations in 16 of its 18 plants to start in 2Q 2011, we project net income toturn positive in 2011e. While year 2012e will benefits from full yearcontribution from these 16 plants (all plants except LDPE and Amines), 2013ewill be the first year of full production at <strong>Saudi</strong> Kayan’s petrochemical complex.Net income is projected to peak in 2013e at SR3,288mn from SR2,279mn in2011e.• Post 2013 earnings to contract as the current cycle nears its peak: Post2013e, net income is likely to contract as the current cycle nears its peak;regional and global capacity additions are likely to outpace demand growth,pressuring prices and utilization rates to decline.• SABIC – a strong partner: <strong>Saudi</strong> Kayan is set to benefit from its closeassociation with SABIC’s (its single largest stakeholder with 35%) global salesand marketing network and distribution channels. <strong>Saudi</strong> Kayan’s entire outputwill be marketed and sold through SABIC.• Valuation: <strong>Saudi</strong> Kayan’s shares have jumped 100.9% in the last 12 months,outpacing the TASI’s growth of 26.7%. Despite trading at a reasonable P/BVmultiple of 2.2x (sector average: 2.9x and TASI: 2.2), we believe the sharesmay have risen too far too fast given the start-up nature of the business. Withour target price of SR20.3 indicating 9.2% downside to the current stocklevels, we initiate with a Neutral rating.Source: BloombergFinancials2009 2010E 2011E 2012E 2013ERevenues SR mn 0 0 12,134 16,773 16,677EBITDA SR mn 0 5 4,039 5,529 5,621Tariq Al-Alaiwatt.alalaiwat@ncbc.comEBITDA margin % n/a n/a 33.3 33.0 33.7Tel. +966 2690 7627 Net income SR mn (17) (96) 2,279 3,247 3,288Net margin % n/a n/a 18.8 19.4 19.7EPS SR (0.01) (0.06) 1.52 2.16 2.19Assets SR mn 35,808 36,099 38,648 39,928 40,374Equity SR mn 15,477 15,381 17,660 19,407 21,195Please refer to the last page forimportant disclaimerSource: Company, <strong>NCBC</strong> Research estimates