1998 - Draper Laboratory
1998 - Draper Laboratory
1998 - Draper Laboratory
- No tags were found...

Create successful ePaper yourself
Turn your PDF publications into a flip-book with our unique Google optimized e-Paper software.
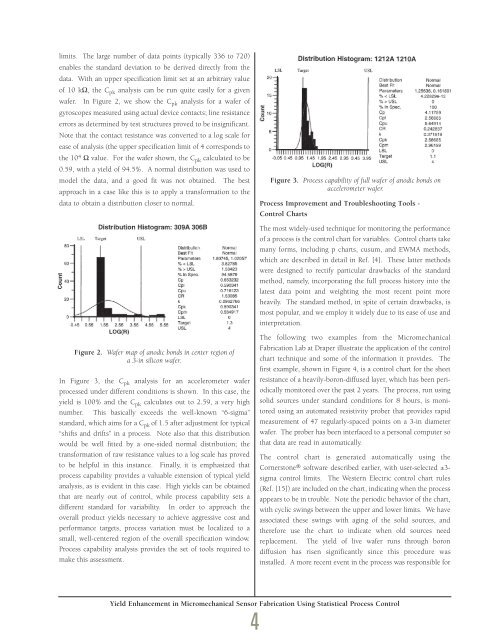
limits. The large number of data points (typically 336 to 720)enables the standard deviation to be derived directly from thedata. With an upper specification limit set at an arbitrary valueof 10 kΩ, the C pk analysis can be run quite easily for a givenwafer. In Figure 2, we show the C pk analysis for a wafer ofgyroscopes measured using actual device contacts; line resistanceerrors as determined by test structures proved to be insignificant.Note that the contact resistance was converted to a log scale forease of analysis (the upper specification limit of 4 corresponds tothe 10 4 Ω value. For the wafer shown, the C pk calculated to be0.59, with a yield of 94.5%. A normal distribution was used tomodel the data, and a good fit was not obtained. The bestapproach in a case like this is to apply a transformation to thedata to obtain a distribution closer to normal.Figure 3. Process capability of full wafer of anodic bonds onaccelerometer wafer.Process Improvement and Troubleshooting Tools -Control ChartsThe most widely-used technique for monitoring the performanceof a process is the control chart for variables. Control charts takemany forms, including p charts, cusum, and EWMA methods,which are described in detail in Ref. [4]. These latter methodswere designed to rectify particular drawbacks of the standardmethod, namely, incorporating the full process history into thelatest data point and weighting the most recent point moreheavily. The standard method, in spite of certain drawbacks, ismost popular, and we employ it widely due to its ease of use andinterpretation.Figure 2. Wafer map of anodic bonds in center region ofa 3-in silicon wafer.In Figure 3, the C pk analysis for an accelerometer waferprocessed under different conditions is shown. In this case, theyield is 100% and the C pk calculates out to 2.59, a very highnumber. This basically exceeds the well-known “6-sigma”standard, which aims for a C pk of 1.5 after adjustment for typical“shifts and drifts” in a process. Note also that this distributionwould be well fitted by a one-sided normal distribution; thetransformation of raw resistance values to a log scale has provedto be helpful in this instance. Finally, it is emphasized thatprocess capability provides a valuable extension of typical yieldanalysis, as is evident in this case. High yields can be obtainedthat are nearly out of control, while process capability sets adifferent standard for variability. In order to approach theoverall product yields necessary to achieve aggressive cost andperformance targets, process variation must be localized to asmall, well-centered region of the overall specification window.Process capability analysis provides the set of tools required tomake this assessment.The following two examples from the MicromechanicalFabrication Lab at <strong>Draper</strong> illustrate the application of the controlchart technique and some of the information it provides. Thefirst example, shown in Figure 4, is a control chart for the sheetresistance of a heavily-boron-diffused layer, which has been periodicallymonitored over the past 2 years. The process, run usingsolid sources under standard conditions for 8 hours, is monitoredusing an automated resistivity prober that provides rapidmeasurement of 47 regularly-spaced points on a 3-in diameterwafer. The prober has been interfaced to a personal computer sothat data are read in automatically.The control chart is generated automatically using theCornerstone ® software described earlier, with user-selected ±3-sigma control limits. The Western Electric control chart rules(Ref. [15]) are included on the chart, indicating when the processappears to be in trouble. Note the periodic behavior of the chart,with cyclic swings between the upper and lower limits. We haveassociated these swings with aging of the solid sources, andtherefore use the chart to indicate when old sources needreplacement. The yield of live wafer runs through borondiffusion has risen significantly since this procedure wasinstalled. A more recent event in the process was responsible forYield Enhancement in Micromechanical Sensor Fabrication Using Statistical Process Control4