1998 - Draper Laboratory
1998 - Draper Laboratory
1998 - Draper Laboratory
- No tags were found...

Create successful ePaper yourself
Turn your PDF publications into a flip-book with our unique Google optimized e-Paper software.
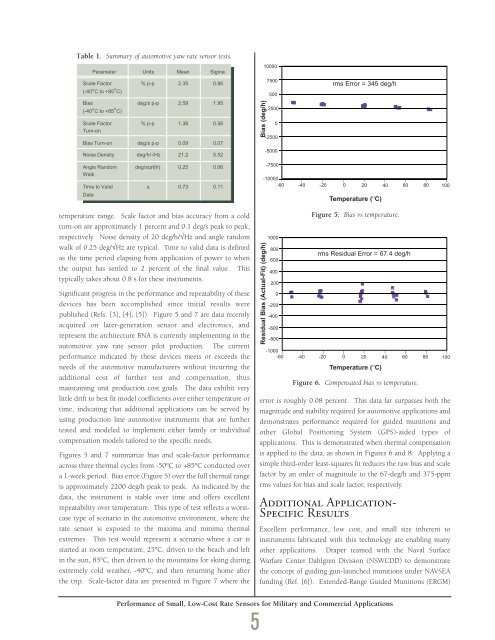
Table 1. Summary of automotive yaw rate sensor tests.100007500500rms Error = 345 deg/hBias (deg/h)25000-2500-5000-7500-10000-60-40 -20 0 20 40 60 80 100Temperature (ºC)temperature range. Scale factor and bias accuracy from a coldturn-on are approximately 1 percent and 0.1 deg/s peak to peak,respectively. Noise density of 20 deg/h/√Hz and angle randomwalk of 0.25 deg/√Hz are typical. Time to valid data is definedas the time period elapsing from application of power to whenthe output has settled to 2 percent of the final value. Thistypically takes about 0.8 s for these instruments.Significant progress in the performance and repeatability of thesedevices has been accomplished since initial results werepublished (Refs. [3], [4], [5]). Figure 5 and 7 are data recentlyacquired on later-generation sensor and electronics, andrepresent the architecture BNA is currently implementing in theautomotive yaw rate sensor pilot production. The currentperformance indicated by these devices meets or exceeds theneeds of the automotive manufacturers without incurring theadditional cost of further test and compensation, thusmaintaining unit production cost goals. The data exhibit verylittle drift to best fit model coefficients over either temperature ortime, indicating that additional applications can be served byusing production line automotive instruments that are furthertested and modeled to implement either family or individualcompensation models tailored to the specific needs.Figures 5 and 7 summarize bias and scale-factor performanceacross three thermal cycles from -50ºC to +85ºC conducted overa 1-week period. Bias error (Figure 5) over the full thermal rangeis approximately 2200 deg/h peak to peak. As indicated by thedata, the instrument is stable over time and offers excellentrepeatability over temperature. This type of test reflects a worstcasetype of scenario in the automotive environment, where therate sensor is exposed to the maxima and minima thermalextremes. This test would represent a scenario where a car isstarted at room temperature, 25ºC, driven to the beach and leftin the sun, 85ºC, then driven to the mountains for skiing duringextremely cold weather, -40ºC, and then returning home afterthe trip. Scale-factor data are presented in Figure 7 where theResidual Bias (Actual-Fit) (deg/h)10008006004002000-200-400-600-800-1000-60Figure 5. Bias vs temperature.rms Residual Error = 67.4 deg/h-40 -20 0 20 40 60 80Temperature (ºC)Figure 6. Compensated bias vs temperature.error is roughly 0.08 percent. This data far surpasses both themagnitude and stability required for automotive applications anddemonstrates performance required for guided munitions andother Global Positioning System (GPS)-aided types ofapplications. This is demonstrated when thermal compensationis applied to the data, as shown in Figures 6 and 8. Applying asimple third-order least-squares fit reduces the raw bias and scalefactor by an order of magnitude to the 67-deg/h and 375-ppmrms values for bias and scale factor, respectively.Additional Application-Specific ResultsExcellent performance, low cost, and small size inherent toinstruments fabricated with this technology are enabling manyother applications. <strong>Draper</strong> teamed with the Naval SurfaceWarfare Center Dahlgren Division (NSWCDD) to demonstratethe concept of guiding gun-launched munitions under NAVSEAfunding (Ref. [6]). Extended-Range Guided Munitions (ERGM)100Performance of Small, Low-Cost Rate Sensors for Military and Commercial Applications5