Figure 7 shows the block diagram of the ADS-B/SurveillanceData Link system. The ADS-B/Surveillance Data Link systemtransmits the IAPR state variable data for the aircraft and receivesthe IAPR state variable data from the adjacent aircraft. The IAPRstate variable data broadcast from the aircraft allows the CollisionAlerting Avionics of other aircraft to predict a collision.Conversely, the IAPR state variable data the aircraft receives fromother aircraft allows it to predict a collision with these aircraft.For the ADS-B/Surveillance Data Link function to be FullyOperational, one ADS-B Processor, one ADS-B Display, theModulator and Transmitter, the Receiver and Demodulator, andthe Antenna must be functional. The Degraded state ischaracterized by invalid knowledge of other aircraft, butownship’s broadcasting capability is functioning. Failed Safeoccurs when there is knowledge of failed broadcast capability,and Failed Uncovered occurs when both broadcast and receptionare compromised without knowledge of capability loss.Table 2 shows the calculated probabilities for the system states ofeach function. The Markov models are constructed using techniquesdescribed in Ref. [12] and are evaluated using version7.9.8 of the SURE Reliability Analysis program (Ref. [12]).Component failure rates and coverage values are inputs to theSURE program, and the actual values used for this calculationrepresent typical values (Refs. [6]-[7], [10]-[12]). The Markovmodel state probabilities are calculated for 4 and 10 hours toillustrate two time intervals from aircraft takeoff to the lineuppoint for an independent approach.The flight tracks used in our Impact Model come from a set ofeight piloted flight track templates developed by Rockwell-Collins using a Fokker 70 flight simulator (Ref. [6]). Thesetracks have been widely used as the set of intruder trajectories fortesting alerting systems (Refs. [4]-[8]). The objective of theimpact model is to choose a flight track that reflects a combinedoperational capability of the aircraft and the pilot that isconsistent with a given system functional state. For example, afully operational aircraft can execute a normal approach, whereasundetected or transient failures could result in unintentional‘drifting’ of the aircraft from a normal approach such as the fakeor overadjust tracks. Degraded navigational capability couldresult in low-level or slow blundering such as 5- or 10-degchanges, and significant failure of guidance and controlcapability or significant pilot error may result in pronouncedblunder behavior of 15- or 30-deg changes (see Table 3).Table 3. Flight tracks for runway approaches.Table 2. Probabilities of operational states.Impact ModelFrom the description of the system reliability model given in theprevious section, each possible system state can be associatedwith an impact that represents a potential reduction in systemcapabilities. To illustrate the safety methodology, different flightapproaches have been chosen to represent the impact of differentsystem functional states. This assignment achieves an associationbetween the system functional state probabilities of the Markovmodel and the operational safety metrics generated from theInteraction-Response Model.The Impact Model mapping used in this application is given inFigure 8. The notation, N1, A1, G1, and P1 refer to the fullyoperational state of the Navigation, Alerting, Guidance andControl, and Pilot functions, respectively. The notation, ~S3,means any surveillance state except S3, the failed safe state.Likewise, N4 is the failed uncovered navigational state, while A3is the failed uncovered state for the alerting avionics function.State N2 is the degraded navigational state, while G2 and P2correspond to ‘recoverable’ error states. States G3 and P3 arenonrecoverable error states in the Guidance and Control andPilot submodels, respectively.An Integrated Safety Analysis Methodology for Emerging Air Transport Technologies7
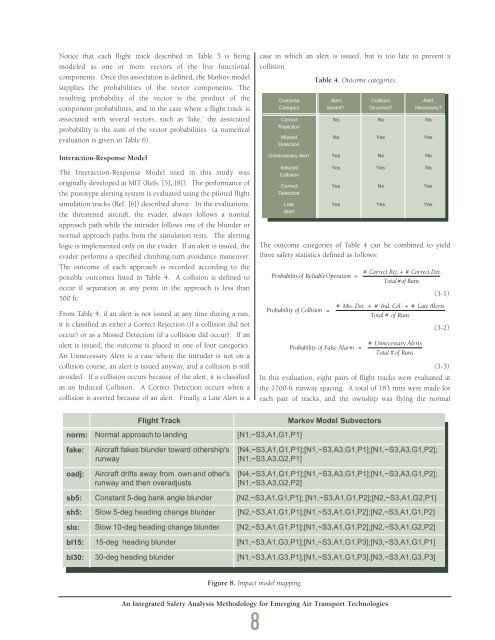
Notice that each flight track described in Table 3 is beingmodeled as one or more vectors of the five functionalcomponents. Once this association is defined, the Markov modelsupplies the probabilities of the vector components. Theresulting probability of the vector is the product of thecomponent probabilities, and in the case where a flight track isassociated with several vectors, such as ‘fake,’ the associatedprobability is the sum of the vector probabilities (a numericalevaluation is given in Table 6).case in which an alert is issued, but is too late to prevent acollision.Table 4. Outcome categories.Interaction-Response ModelThe Interaction-Response Model used in this study wasoriginally developed at MIT (Refs. [5], [8]). The performance ofthe prototype alerting system is evaluated using the piloted flightsimulation tracks (Ref. [6]) described above. In the evaluations,the threatened aircraft, the evader, always follows a normalapproach path while the intruder follows one of the blunder ornormal approach paths from the simulation tests. The alertinglogic is implemented only on the evader. If an alert is issued, theevader performs a specified climbing-turn avoidance maneuver.The outcome of each approach is recorded according to thepossible outcomes listed in Table 4. A collision is defined tooccur if separation at any point in the approach is less than500 ft.From Table 4, if an alert is not issued at any time during a run,it is classified as either a Correct Rejection (if a collision did notoccur) or as a Missed Detection (if a collision did occur). If analert is issued, the outcome is placed in one of four categories.An Unnecessary Alert is a case where the intruder is not on acollision course, an alert is issued anyway, and a collision is stillavoided. If a collision occurs because of the alert, it is classifiedas an Induced Collision. A Correct Detection occurs when acollision is averted because of an alert. Finally, a Late Alert is aThe outcome categories of Table 4 can be combined to yieldthree safety statistics defined as follows:ProbabilityofReliableOperation=Probability of Collision =Probability of False Alarm =# Correct Rej. + # Correct Det.Total # of Runs(3-1)# Mis. Det. + # Ind. Col. + # Late AlertsTotal # of Runs# Unnecessary AlertsTotal # of Runs(3-2)(3-3)In this evaluation, eight pairs of flight tracks were evaluated atthe 1700-ft runway spacing. A total of 183 runs were made foreach pair of tracks, and the ownship was flying the normalFlight Tracknorm: Normal approach to landing [N1,~S3,A1,G1,P1]Markov Model Subvectorsfake:oadj:Aircraft fakes blunder toward othership'srunwayAircraft drifts away from own and other'srunway and then overadjusts[N4,~S3,A1,G1,P1];[N1,~S3,A3,G1,P1];[N1,~S3,A3,G1,P2];[N1,~S3,A3,G2,P1][N4,~S3,A1,G1,P1];[N1,~S3,A3,G1,P1];[N1,~S3,A3,G1,P2];[N1,~S3,A3,G2,P2]sb5: Constant 5-deg bank angle blunder [N2,~S3,A1,G1,P1]; [N1,~S3,A1,G1,P2];[N2,~S3,A1,G2,P1]sh5: Slow 5-deg heading change blunder [N2,~S3,A1,G1,P1];[N1,~S3,A1,G1,P2];[N2,~S3,A1,G1,P2]slo: Slow 10-deg heading change blunder [N2,~S3,A1,G1,P1];[N1,~S3,A1,G1,P2];[N2,~S3,A1,G2,P2]bl15: 15-deg heading blunder [N1,~S3,A1,G3,P1];[N1,~S3,A1,G1,P3];[N3,~S3,A1,G1,P1]bl30: 30-deg heading blunder [N1,~S3,A1,G3,P1];[N1,~S3,A1,G1,P3];[N3,~S3,A1,G3,P3]Figure 8. Impact model mapping.An Integrated Safety Analysis Methodology for Emerging Air Transport Technologies8
- Page 2 and 3:
Letter from thePresident and CEO,Vi
- Page 4 and 5:
Information TechnologyMilton AdamsE
- Page 6 and 7:
BiographyMilton Adams has been at D
- Page 9 and 10:
Figure 1 represents a functional de
- Page 11 and 12:
Programs. In effect, these controll
- Page 13 and 14:
Although the terminal area traffic
- Page 15 and 16:
Table 2. ATFM performance evaluatio
- Page 17 and 18:
In the experiments, a nominal capac
- Page 19 and 20:
[3] Wambsganss, Michael C. “Colla
- Page 21 and 22:
Guidance, Navigation, and Control A
- Page 23 and 24:
A Control Lyapunov FunctionApproach
- Page 25 and 26:
x( 0) ∈ X and w(t) ∈Wfor all t
- Page 27 and 28:
(b) Select a quadratic RCLF V i (x)
- Page 29 and 30:
at each grid point. In the case w 1
- Page 31 and 32:
References[1] Ball, J.A. and A.J. v
- Page 33 and 34:
Guidance, Navigation, and Control A
- Page 35 and 36:
Relative and Differential GPSData T
- Page 37 and 38:
The first term on the right in the
- Page 39 and 40:
H R# δρ R,GPS -H A# δρ A,GPSThi
- Page 41 and 42:
selection; and (3) shown that the a
- Page 43 and 44:
Guidance, Navigation, and Control A
- Page 45 and 46:
Segmentation of MR ImagesUsing Curv
- Page 47 and 48:
(3)where ν now represents a contin
- Page 49 and 50:
Experimental ResultsThe results of
- Page 51 and 52:
Table 1. A summary of segmentation
- Page 53 and 54:
Guidance, Navigation,and ControlJim
- Page 55 and 56:
BiographyGeorge SchmidtGeorge Schmi
- Page 57 and 58:
clock and ephemeris errors, as well
- Page 59 and 60:
maintained in a rigid structure, wh
- Page 61 and 62:
Table 5. “Typical” absolute GPS
- Page 63 and 64:
performed, then the target location
- Page 65 and 66:
tightly-coupled system, however, ca
- Page 67 and 68:
Concluding RemarksRecent progress i
- Page 69 and 70:
As real-time systems evolve into th
- Page 71 and 72:
Advanced Fault-TolerantComputing fo
- Page 73 and 74:
The Viking and Voyager were both in
- Page 75 and 76:
Containment Regions (FCRs). There a
- Page 77 and 78:
well as reversing the whole process
- Page 79 and 80:
As real-time systems evolve into th
- Page 81 and 82:
Automated Station-Keepingfor Satell
- Page 83 and 84:
Figure 2. Minimum elevation angles
- Page 85 and 86:
anomaly M and/or the ascending node
- Page 87 and 88:
However, since optimization and rec
- Page 89 and 90:
is maintained in the Northern Hemis
- Page 91 and 92:
autonomy. It must have the ability
- Page 93 and 94:
[31] Neelon, Joseph G., Jr., Paul J
- Page 95 and 96:
Draper’s primary goal is to Drape
- Page 97 and 98: )Rotordynamic Modelingof an Activel
- Page 99 and 100: Eq. (9) becomes:λ[ R ] { Φ } = [
- Page 101 and 102: chosen to be 24, for a total of 48
- Page 103 and 104: InertialInstruments/MechanicalDesig
- Page 105 and 106: BiographyJeffrey Borenstein is curr
- Page 107 and 108: process step. Process information i
- Page 109 and 110: Figure 4. Control chart for boron d
- Page 111 and 112: References[1] Barbour, N., J. Conne
- Page 113 and 114: Draper Laboratory continues to engi
- Page 115 and 116: Validating the Validating Tool:Defi
- Page 117 and 118: calculates miscellaneous terms, suc
- Page 119 and 120: Table 1. Suggested specification sh
- Page 121 and 122: User Accuracy as aFunction of Simul
- Page 123 and 124: 20-min averaging, this clock lockin
- Page 125 and 126: Table 2. Sample high-level summary
- Page 127 and 128: AcknowledgmentR.L. Greenspan, J.A.
- Page 129 and 130: Systems IntegrationRich MartoranaPe
- Page 131 and 132: BiographyAnthony Kourepenis is an A
- Page 133 and 134: control is employed to maintain the
- Page 135 and 136: Table 1. Summary of automotive yaw
- Page 137 and 138: Resolution (60 Hz) deg/h10000000100
- Page 139 and 140: References[1] Greiff, P., B. Boxenh
- Page 141 and 142: Guidance, Navigation, and Control A
- Page 143 and 144: An Integrated Safety AnalysisMethod
- Page 145 and 146: Infrastructure ModelsSystemRequirem
- Page 147: Figures 6 and 7 illustrate the bloc
- Page 151 and 152: Table 7. Safety statistics at 1700-
- Page 153 and 154: Guidance, Navigation, and Control A
- Page 155 and 156: An Optimal Guidance Law forPlanetar
- Page 157 and 158: Note that the states in the three d
- Page 159 and 160: Crossrange (Kft)10090807060504030Cl
- Page 161 and 162: The 1997 Charles StarkDraper PrizeT
- Page 163 and 164: The 1997 Charles StarkDraper Prize1
- Page 165 and 166: “Draper encourages its personnel
- Page 167 and 168: Gimballed Vibrating GyroscopeHaving
- Page 169 and 170: “Draper encourages its personnel
- Page 171 and 172: Optical Source Isolator withPolariz
- Page 173 and 174: “Draper encourages its personnel
- Page 175 and 176: Hunting Suppressor forPolyphase Ele
- Page 177 and 178: “Draper encourages its personnel
- Page 179 and 180: Sensor Having an Off-Frequency Driv
- Page 181 and 182: proof mass from transients and enha
- Page 183 and 184: 1997 Published PapersThe following
- Page 185 and 186: monitoring of space structures and
- Page 187 and 188: measured by kinematic degrees of fr
- Page 189 and 190: i.e., what percent of the earth’s
- Page 191 and 192: McConley, M. W.; Dahleh, M. A.; Fer
- Page 193 and 194: unaffordable, or even misguided. Bu
- Page 195 and 196: The Draper DistinguishedPerformance
- Page 197: Educational Activitiesat Draper Lab