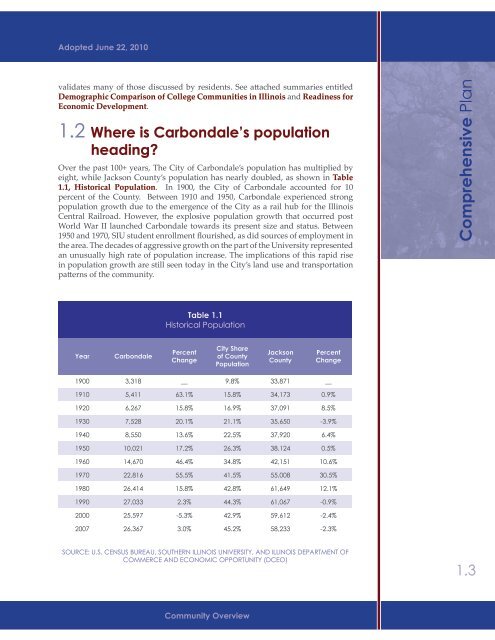
Adopted June 22, 2010validates many of those discussed by residents. See attached summaries entitledDemographic Comparison of College Communities in Illinois and Readiness forEconomic Development.1.2 Where is <strong>Carbondale</strong>’s populationheading?Over the past 100+ years, The City of <strong>Carbondale</strong>’s population has multiplied byeight, while Jackson County’s population has nearly doubled, as shown in Table1.1, Historical Population. In 1900, the City of <strong>Carbondale</strong> accounted for 10percent of the County. Between 1910 and 1950, <strong>Carbondale</strong> experienced strongpopulation growth due to the emergence of the City as a rail hub for the IllinoisCentral Railroad. However, the explosive population growth that occurred postWorld War II launched <strong>Carbondale</strong> towards its present size and status. Between1950 and 1970, SIU student enrollment flourished, as did sources of employment inthe area. The decades of aggressive growth on the part of the University representedan unusually high rate of population increase. The implications of this rapid risein population growth are still seen today in the City’s land use and transportationpatterns of the community.<strong>Comprehensive</strong> <strong>Plan</strong>Table 1.1Historical PopulationYear<strong>Carbondale</strong>PercentChangeCity Shareof CountyPopulationJacksonCountyPercentChange1900 3,318 __ 9.8% 33,871 __1910 5,411 63.1% 15.8% 34,173 0.9%1920 6,267 15.8% 16.9% 37,091 8.5%1930 7,528 20.1% 21.1% 35,650 -3.9%1940 8,550 13.6% 22.5% 37,920 6.4%1950 10,021 17.2% 26.3% 38,124 0.5%1960 14,670 46.4% 34.8% 42,151 10.6%1970 22,816 55.5% 41.5% 55,008 30.5%1980 26,414 15.8% 42.8% 61,649 12.1%1990 27,033 2.3% 44.3% 61,067 -0.9%2000 25,597 -5.3% 42.9% 59,612 -2.4%2007 26,367 3.0% 45.2% 58,233 -2.3%SOURCE: U.S. CENSUS BUREAU, SOUTHERN <strong>IL</strong>LINOIS UNIVERSITY, AND <strong>IL</strong>LINOIS DEPARTMENT OFCOMMERCE AND ECONOMIC OPPORTUNITY (DCEO)1.3Community Overview
Adopted June 22, 2010City of <strong>Carbondale</strong>Figure 1.1 | PAST AND PROJECTED POPULATIONSPopulationPopulation70,00070,00060,000 60,00050,000 50,00040,00040,00030,00030,00020,00020,00010,00010,00000Jackson CountySouthern Illinois University<strong>Carbondale</strong>TargetPopulation1900 1910 1920 1930 1940 1950 1960 1970 1980 1990 2000 2010 2020 20301900 1910 1920 1930 1940 1950 1960Year1970 1980 1990 2000 2010 2020 2030YearFigure 1.2 | POPULATION OF COMPARISON CITIESPopulation30,00025,00020,00015,00010,0005,0000<strong>Carbondale</strong>CartervilleDu QuoinHerrinMarionMurphysboro<strong>Carbondale</strong>Du Quoin1930 1940 1950 1960 1970 1980 1990 2000YearHerrinMarionMurphysboroCarterville<strong>Carbondale</strong>’s populationhas fluctuated in the past,with more moderategrowth in recent decades.Figure 1.1, Past andProjected Populations,shows the previous andprojected future growthof <strong>Carbondale</strong> comparedto the SIU enrollmentand Jackson Countypopulation. <strong>Carbondale</strong>’sprimary years of populationgrowth occurred between1950 and 1970 (12,795people). Not surprisingly,this population growthpattern closely reflects theSIU enrollment trends.As student enrollmenthas leveled off in recentyears, there is reducedgrowth associated with theUniversity presence. Whilethere is not necessarily adirect relationship betweentotal enrollment and totalpopulation, it is worthnoting the trend as part ofa long-term perspective ofthe community. Lookingahead, it could be expectedthat another dramaticrise (or fall) in studentenrollment would have asimilar impact on the City’spopulation. At present,the overall SIU studentenrollment is expected toremain steady in the nearterm.1.4Since 1970, the City has experienced small increases in population, with theexception occurring between 1990 and 2000, when the City experienced a 5.3percent decrease in population. However, recent estimates show these numbersrebounding. Similarly, Jackson County was estimated to have 58,233 residents in2007, representing a 2.3 percent decrease since 2000. The City’s population hasleveled off since 1990 and remains around 26,367 persons 1 . At present, just underhalf of the Jackson County population lives in <strong>Carbondale</strong>. This share of Countypopulation appears to be stable, remaining at about 43 percent over the past 40 years.Population projections, using a step-down methodology, indicate that <strong>Carbondale</strong>1 U.S. Census Bureau, 2007 estimateChapter One
- Page 1: Adopted June 22, 2010
- Page 4 and 5: Adopted June 22, 2010City of Carbon
- Page 6 and 7: Adopted June 22, 2010City of Carbon
- Page 8 and 9: Adopted June 22, 20101CommunityOver
- Page 12 and 13: DemographicComparisonEducation% Pop
- Page 14 and 15: Adopted June 22, 2010will remain st
- Page 16 and 17: Adopted June 22, 2010factors for re
- Page 18 and 19: Adopted June 22, 2010strategies, in
- Page 20 and 21: Adopted June 22, 2010To facilitate
- Page 22 and 23: Adopted June 22, 2010A priority-set
- Page 24 and 25: Adopted June 22, 2010Infill Develop
- Page 26 and 27: Adopted June 22, 2010the community
- Page 28 and 29: 2Land Use CharacterAdopted June 22,
- Page 30 and 31: Adopted June 22, 2010• Strategy 3
- Page 32 and 33: Adopted June 22, 2010community char
- Page 34 and 35: Adopted June 22, 2010DesignationTab
- Page 36 and 37: Adopted June 22, 2010Summary of exi
- Page 38 and 39: Adopted June 22, 2010a priority (al
- Page 40 and 41: Adopted June 22, 2010Park Service A
- Page 42 and 43: Adopted June 22, 2010area (see Map
- Page 44 and 45: Adopted June 22, 2010environmental
- Page 46 and 47: Adopted June 22, 2010as a valuable
- Page 48 and 49: Adopted June 22, 2010c. Improve acc
- Page 50 and 51: Adopted June 22, 2010District / Dev
- Page 52 and 53: Adopted June 22, 2010Actions and In
- Page 54 and 55: Adopted June 22, 2010The “communi
- Page 56 and 57: Adopted June 22, 2010Actions and In
- Page 58 and 59: Adopted June 22, 2010building place
- Page 60 and 61:
Adopted June 22, 2010during the lat
- Page 62 and 63:
Adopted June 22, 2010Plan. This dis
- Page 64 and 65:
Adopted June 22, 2010monotony by re
- Page 66 and 67:
Adopted June 22, 2010g. Amend the c
- Page 68 and 69:
Adopted June 22, 2010effective in a
- Page 70 and 71:
AIRPORT RDService2.2ParkAreasPARKS
- Page 72 and 73:
COUNTRY CLUB RDS. OAKLAND AVEMurphy
- Page 75 and 76:
Adopted June 22, 20103CommunityMobi
- Page 77 and 78:
Adopted June 22, 20103.3 Existing C
- Page 79 and 80:
Adopted June 22, 2010Existing Stree
- Page 81 and 82:
Adopted June 22, 2010caused by turn
- Page 83 and 84:
Adopted June 22, 2010secondary arte
- Page 85 and 86:
Adopted June 22, 2010of traffic sig
- Page 87 and 88:
Adopted June 22, 2010number and wid
- Page 89 and 90:
Adopted June 22, 2010e. Coordinate
- Page 91 and 92:
Adopted June 22, 2010STREETSCAPE MA
- Page 93 and 94:
Adopted June 22, 2010c. Re-evaluate
- Page 95 and 96:
Adopted June 22, 2010streets’ imp
- Page 97 and 98:
Adopted June 22, 2010Downtown Carbo
- Page 99 and 100:
COUNTRY CLUB RDN. BILLY BRYAN STS.
- Page 101 and 102:
3.3SalukiExpress RoutesTRANSIT ROUT
- Page 103 and 104:
Adopted June 22, 20104Housing &Neig
- Page 105 and 106:
Adopted June 22, 2010Summary of Hou
- Page 107 and 108:
Adopted June 22, 2010the 1970’s.
- Page 109 and 110:
Adopted June 22, 2010Figure 4.3 | O
- Page 111 and 112:
Adopted June 22, 2010units. This su
- Page 113 and 114:
Adopted June 22, 2010poverty, conve
- Page 115 and 116:
Adopted June 22, 2010from increased
- Page 117 and 118:
Adopted June 22, 2010Rationale:In s
- Page 119 and 120:
Adopted June 22, 2010Strategy 2: Ut
- Page 121 and 122:
Adopted June 22, 2010building orien
- Page 123 and 124:
Adopted June 22, 2010Table 4.5Incom
- Page 125 and 126:
Adopted June 22, 2010including publ
- Page 127 and 128:
COUNTRY CLUB RDN. MARION STBig Mudd
- Page 129 and 130:
Big Muddy R.104.03Big Muddy R.Crab
- Page 131 and 132:
COUNTRY CLUB RDN. MARION STMurphysb
- Page 133 and 134:
Adopted June 22, 2010City of Carbon
- Page 135 and 136:
Adopted June 22, 2010City of Carbon
- Page 137 and 138:
Adopted June 22, 2010City of Carbon
- Page 139 and 140:
Adopted June 22, 2010City of Carbon
- Page 141 and 142:
Adopted June 22, 2010City of Carbon
- Page 143 and 144:
Adopted June 22, 2010City of Carbon
- Page 145 and 146:
Adopted June 22, 2010City of Carbon
- Page 147 and 148:
Adopted June 22, 2010City of Carbon
- Page 149 and 150:
Adopted June 22, 2010City of Carbon
- Page 151 and 152:
Adopted June 22, 2010City of Carbon
- Page 153 and 154:
Adopted June 22, 2010City of Carbon
- Page 155 and 156:
Adopted June 22, 2010City of Carbon
- Page 157 and 158:
Adopted June 22, 2010City of Carbon
- Page 159 and 160:
Adopted June 22, 2010City of Carbon
- Page 161 and 162:
Adopted June 22, 2010City of Carbon
- Page 163 and 164:
Adopted June 22, 2010City of Carbon
- Page 165 and 166:
Adopted June 22, 2010City of Carbon