Adopted June 22, 2010City of <strong>Carbondale</strong>Percent of MedianFamily Incomemortgage.Table 4.3Housing AffordabilityMedian FamilyIncomeAffordableMortgage Payment180% $90,880.20 $2,272150% $75,733.50 $1,893130% $65,635.70 $1,641100% $50,400.00 $1,26280% $40,391.20 $1,01050% $25,244.50 $63130% $15,146.70 $379Housing affordability is generally defined in several ways. A widely used standarddeveloped by the Department of Housing and Urban Development (HUD) statesthat a family or household can afford to spend 30 percent of its income on housing.This percentage leaves a sufficient amount of income for other essential householdneeds. Households who pay more than 30 percent of their income for housingare described as “cost burdened.” According to the 2008 US Census AmericanCommunity Survey, approximately 71 percent of <strong>Carbondale</strong>’s renting householdspaid more than 30 percent of their income for rent, and 20 percent of the owneroccupiedhouseholdspaid more than 30percent of their monthlyincome for a mortgage. Inthe <strong>Carbondale</strong> area, themedian family incomein 2008 was $50,489. Forhousing to be consideredaffordable to a familyearning the medianincome, housing costscould not exceed $1,262in a month regardless ofthe type or terms of theAt a glance, <strong>Carbondale</strong> is relatively affordable when comparing the median familyincome and the median priced home. This basic theory is clear in the affordabilitylevels examined in Table 4.3, Housing Affordability, which breaks down monthlyhousing costs. However, newly constructed homes, at any level of quality, maycost more than the median priced existing home and may be beyond reach for themedian income family in <strong>Carbondale</strong>. Therefore, the level of housing affordabilityis much less when new construction is involved and even further constricted asnew lending limits are enacted. Although the mortgage issues are nationwide andthe lack of new workforce housing is constrained in <strong>Carbondale</strong>, the end result is amultiplier of impacts that cut into the ability to buy a home. As explained in Figure4.10, Housing Options, this situation can result in potential homebuyers seekinghousing options elsewhere.Evaluating median household incomes in Map 4.5, Median Household Incomeby Block Group, indicates that income only loosely corresponds with the otherhousing indicators (vacancy, tenure, and age). A very similar area denoted as thezero to 20 percent ownership rate on the ‘Housing Tenure’ map also has the lowestmedian household income range of $0 to $10,000 per year. This, in accordance withhousing tenure, as well, is largely due to the college campus being located withinthe center of the city. While the core neighborhoods that are closest to the city centerand SIU campus are the ones that maintain the lowest incomes, there appears tobe an east/west divide in income. Areas east of the railroad have generally lowermedian incomes in comparison to the west, as the eastern areas average between$10,000 and $40,000 per year, while the western neighborhoods average $20,000 to$60,000 per year.4.14Strategy 1: Provide housing options and assistance aimed at a variety of incomelevels and household age groups, both now and in the future.Chapter Four
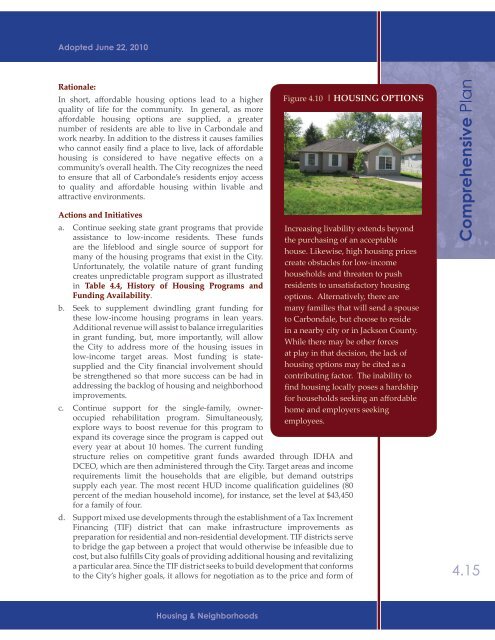
Adopted June 22, 2010Rationale:In short, affordable housing options lead to a higherquality of life for the community. In general, as moreaffordable housing options are supplied, a greaternumber of residents are able to live in <strong>Carbondale</strong> andwork nearby. In addition to the distress it causes familieswho cannot easily find a place to live, lack of affordablehousing is considered to have negative effects on acommunity’s overall health. The City recognizes the needto ensure that all of <strong>Carbondale</strong>’s residents enjoy accessto quality and affordable housing within livable andattractive environments.Actions and Initiativesa. Continue seeking state grant programs that provideassistance to low-income residents. These fundsare the lifeblood and single source of support formany of the housing programs that exist in the City.Unfortunately, the volatile nature of grant fundingcreates unpredictable program support as illustratedin Table 4.4, History of Housing Programs andFunding Availability.b. Seek to supplement dwindling grant funding forthese low-income housing programs in lean years.Additional revenue will assist to balance irregularitiesin grant funding, but, more importantly, will allowthe City to address more of the housing issues inlow-income target areas. Most funding is statesuppliedand the City financial involvement shouldbe strengthened so that more success can be had inaddressing the backlog of housing and neighborhoodimprovements.c. Continue support for the single-family, owneroccupiedrehabilitation program. Simultaneously,explore ways to boost revenue for this program toexpand its coverage since the program is capped outevery year at about 10 homes. The current fundingFigure 4.10 | HOUSING OPTIONSIncreasing livability extends beyondthe purchasing of an acceptablehouse. Likewise, high housing pricescreate obstacles for low-incomehouseholds and threaten to pushresidents to unsatisfactory housingoptions. Alternatively, there aremany families that will send a spouseto <strong>Carbondale</strong>, but choose to residein a nearby city or in Jackson County.While there may be other forcesat play in that decision, the lack ofhousing options may be cited as acontributing factor. The inability tofind housing locally poses a hardshipfor households seeking an affordablehome and employers seekingemployees.structure relies on competitive grant funds awarded through IDHA andDCEO, which are then administered through the City. Target areas and incomerequirements limit the households that are eligible, but demand outstripssupply each year. The most recent HUD income qualification guidelines (80percent of the median household income), for instance, set the level at $43,450for a family of four.d. Support mixed use developments through the establishment of a Tax IncrementFinancing (TIF) district that can make infrastructure improvements aspreparation for residential and non-residential development. TIF districts serveto bridge the gap between a project that would otherwise be infeasible due tocost, but also fulfills City goals of providing additional housing and revitalizinga particular area. Since the TIF district seeks to build development that conformsto the City’s higher goals, it allows for negotiation as to the price and form of<strong>Comprehensive</strong> <strong>Plan</strong>4.15Housing & Neighborhoods
- Page 1:
Adopted June 22, 2010
- Page 4 and 5:
Adopted June 22, 2010City of Carbon
- Page 6 and 7:
Adopted June 22, 2010City of Carbon
- Page 8 and 9:
Adopted June 22, 20101CommunityOver
- Page 10 and 11:
Adopted June 22, 2010validates many
- Page 12 and 13:
DemographicComparisonEducation% Pop
- Page 14 and 15:
Adopted June 22, 2010will remain st
- Page 16 and 17:
Adopted June 22, 2010factors for re
- Page 18 and 19:
Adopted June 22, 2010strategies, in
- Page 20 and 21:
Adopted June 22, 2010To facilitate
- Page 22 and 23:
Adopted June 22, 2010A priority-set
- Page 24 and 25:
Adopted June 22, 2010Infill Develop
- Page 26 and 27:
Adopted June 22, 2010the community
- Page 28 and 29:
2Land Use CharacterAdopted June 22,
- Page 30 and 31:
Adopted June 22, 2010• Strategy 3
- Page 32 and 33:
Adopted June 22, 2010community char
- Page 34 and 35:
Adopted June 22, 2010DesignationTab
- Page 36 and 37:
Adopted June 22, 2010Summary of exi
- Page 38 and 39:
Adopted June 22, 2010a priority (al
- Page 40 and 41:
Adopted June 22, 2010Park Service A
- Page 42 and 43:
Adopted June 22, 2010area (see Map
- Page 44 and 45:
Adopted June 22, 2010environmental
- Page 46 and 47:
Adopted June 22, 2010as a valuable
- Page 48 and 49:
Adopted June 22, 2010c. Improve acc
- Page 50 and 51:
Adopted June 22, 2010District / Dev
- Page 52 and 53:
Adopted June 22, 2010Actions and In
- Page 54 and 55:
Adopted June 22, 2010The “communi
- Page 56 and 57:
Adopted June 22, 2010Actions and In
- Page 58 and 59:
Adopted June 22, 2010building place
- Page 60 and 61:
Adopted June 22, 2010during the lat
- Page 62 and 63:
Adopted June 22, 2010Plan. This dis
- Page 64 and 65:
Adopted June 22, 2010monotony by re
- Page 66 and 67: Adopted June 22, 2010g. Amend the c
- Page 68 and 69: Adopted June 22, 2010effective in a
- Page 70 and 71: AIRPORT RDService2.2ParkAreasPARKS
- Page 72 and 73: COUNTRY CLUB RDS. OAKLAND AVEMurphy
- Page 75 and 76: Adopted June 22, 20103CommunityMobi
- Page 77 and 78: Adopted June 22, 20103.3 Existing C
- Page 79 and 80: Adopted June 22, 2010Existing Stree
- Page 81 and 82: Adopted June 22, 2010caused by turn
- Page 83 and 84: Adopted June 22, 2010secondary arte
- Page 85 and 86: Adopted June 22, 2010of traffic sig
- Page 87 and 88: Adopted June 22, 2010number and wid
- Page 89 and 90: Adopted June 22, 2010e. Coordinate
- Page 91 and 92: Adopted June 22, 2010STREETSCAPE MA
- Page 93 and 94: Adopted June 22, 2010c. Re-evaluate
- Page 95 and 96: Adopted June 22, 2010streets’ imp
- Page 97 and 98: Adopted June 22, 2010Downtown Carbo
- Page 99 and 100: COUNTRY CLUB RDN. BILLY BRYAN STS.
- Page 101 and 102: 3.3SalukiExpress RoutesTRANSIT ROUT
- Page 103 and 104: Adopted June 22, 20104Housing &Neig
- Page 105 and 106: Adopted June 22, 2010Summary of Hou
- Page 107 and 108: Adopted June 22, 2010the 1970’s.
- Page 109 and 110: Adopted June 22, 2010Figure 4.3 | O
- Page 111 and 112: Adopted June 22, 2010units. This su
- Page 113 and 114: Adopted June 22, 2010poverty, conve
- Page 115: Adopted June 22, 2010from increased
- Page 119 and 120: Adopted June 22, 2010Strategy 2: Ut
- Page 121 and 122: Adopted June 22, 2010building orien
- Page 123 and 124: Adopted June 22, 2010Table 4.5Incom
- Page 125 and 126: Adopted June 22, 2010including publ
- Page 127 and 128: COUNTRY CLUB RDN. MARION STBig Mudd
- Page 129 and 130: Big Muddy R.104.03Big Muddy R.Crab
- Page 131 and 132: COUNTRY CLUB RDN. MARION STMurphysb
- Page 133 and 134: Adopted June 22, 2010City of Carbon
- Page 135 and 136: Adopted June 22, 2010City of Carbon
- Page 137 and 138: Adopted June 22, 2010City of Carbon
- Page 139 and 140: Adopted June 22, 2010City of Carbon
- Page 141 and 142: Adopted June 22, 2010City of Carbon
- Page 143 and 144: Adopted June 22, 2010City of Carbon
- Page 145 and 146: Adopted June 22, 2010City of Carbon
- Page 147 and 148: Adopted June 22, 2010City of Carbon
- Page 149 and 150: Adopted June 22, 2010City of Carbon
- Page 151 and 152: Adopted June 22, 2010City of Carbon
- Page 153 and 154: Adopted June 22, 2010City of Carbon
- Page 155 and 156: Adopted June 22, 2010City of Carbon
- Page 157 and 158: Adopted June 22, 2010City of Carbon
- Page 159 and 160: Adopted June 22, 2010City of Carbon
- Page 161 and 162: Adopted June 22, 2010City of Carbon
- Page 163 and 164: Adopted June 22, 2010City of Carbon
- Page 165 and 166: Adopted June 22, 2010City of Carbon