SBR- Content.pmd - INBO
SBR- Content.pmd - INBO
SBR- Content.pmd - INBO
Create successful ePaper yourself
Turn your PDF publications into a flip-book with our unique Google optimized e-Paper software.
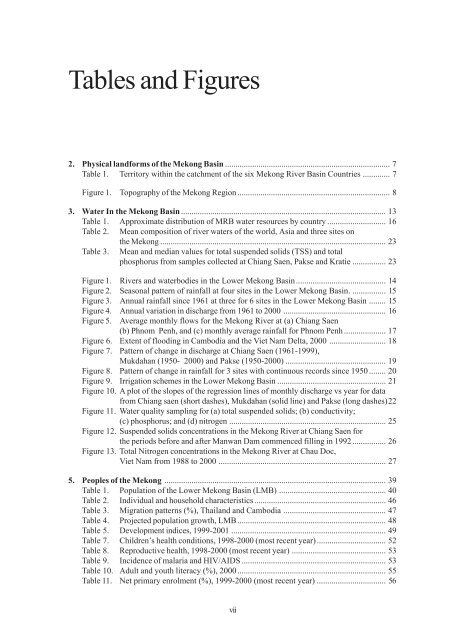
Tables and Figures2. Physical landforms of the Mekong Basin ............................................................................... 7Table 1. Territory within the catchment of the six Mekong River Basin Countries ............. 7Figure 1. Topography of the Mekong Region ......................................................................... 83. Water In the Mekong Basin .................................................................................................. 13Table 1. Approximate distribution of MRB water resources by country ............................ 16Table 2. Mean composition of river waters of the world, Asia and three sites onthe Mekong ............................................................................................................ 23Table 3. Mean and median values for total suspended solids (TSS) and totalphosphorus from samples collected at Chiang Saen, Pakse and Kratie ................ 23Figure 1. Rivers and waterbodies in the Lower Mekong Basin........................................... 14Figure 2. Seasonal pattern of rainfall at four sites in the Lower Mekong Basin. ................ 15Figure 3. Annual rainfall since 1961 at three for 6 sites in the Lower Mekong Basin ........ 15Figure 4. Annual variation in discharge from 1961 to 2000 ................................................. 16Figure 5.Average monthly flows for the Mekong River at (a) Chiang Saen(b) Phnom Penh, and (c) monthly average rainfall for Phnom Penh .................... 17Figure 6. Extent of flooding in Cambodia and the Viet Nam Delta, 2000 ........................... 18Figure 7. Pattern of change in discharge at Chiang Saen (1961-1999),Mukdahan (1950- 2000) and Pakse (1950-2000) ................................................ 19Figure 8. Pattern of change in rainfall for 3 sites with continuous records since 1950 ........ 20Figure 9. Irrigation schemes in the Lower Mekong Basin .................................................... 21Figure 10. A plot of the slopes of the regression lines of monthly discharge vs year for datafrom Chiang saen (short dashes), Mukdahan (solid line) and Pakse (long dashes)22Figure 11. Water quality sampling for (a) total suspended solids; (b) conductivity;(c) phosphorus; and (d) nitrogen ........................................................................... 25Figure 12. Suspended solids concentrations in the Mekong River at Chiang Saen forthe periods before and after Manwan Dam commenced filling in 1992 ................ 26Figure 13. Total Nitrogen concentrations in the Mekong River at Chau Doc,Viet Nam from 1988 to 2000 ................................................................................ 275. Peoples of the Mekong .......................................................................................................... 39Table 1. Population of the Lower Mekong Basin (LMB) ................................................... 40Table 2. Individual and household characteristics............................................................... 46Table 3. Migration patterns (%), Thailand and Cambodia ................................................. 47Table 4. Projected population growth, LMB ....................................................................... 48Table 5. Development indices, 1999-2001 .......................................................................... 49Table 7. Children’s health conditions, 1998-2000 (most recent year) ................................. 52Table 8. Reproductive health, 1998-2000 (most recent year) ............................................. 53Table 9. Incidence of malaria and HIV/AIDS ..................................................................... 53Table 10. Adult and youth literacy (%), 2000 ....................................................................... 55Table 11. Net primary enrolment (%), 1999-2000 (most recent year) ................................. 56vii


