SBR- Content.pmd - INBO
SBR- Content.pmd - INBO
SBR- Content.pmd - INBO

You also want an ePaper? Increase the reach of your titles
YUMPU automatically turns print PDFs into web optimized ePapers that Google loves.
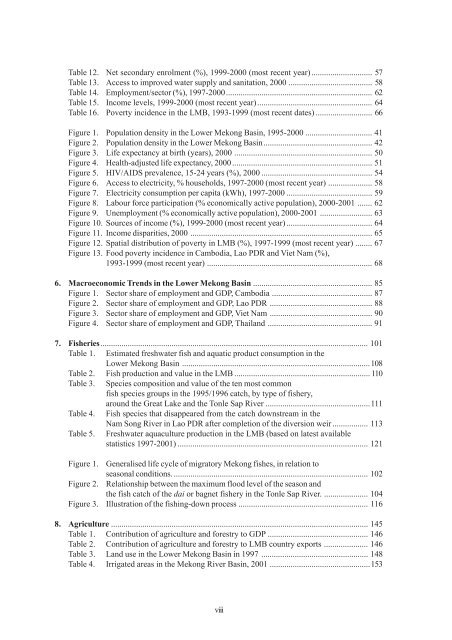
Table 12. Net secondary enrolment (%), 1999-2000 (most recent year) ............................. 57Table 13. Access to improved water supply and sanitation, 2000 ........................................ 58Table 14. Employment/sector (%), 1997-2000...................................................................... 62Table 15. Income levels, 1999-2000 (most recent year)....................................................... 64Table 16. Poverty incidence in the LMB, 1993-1999 (most recent dates) ........................... 66Figure 1. Population density in the Lower Mekong Basin, 1995-2000 ................................ 41Figure 2. Population density in the Lower Mekong Basin.................................................... 42Figure 3. Life expectancy at birth (years), 2000 .................................................................. 50Figure 4. Health-adjusted life expectancy, 2000................................................................... 51Figure 5. HIV/AIDS prevalence, 15-24 years (%), 2000 ..................................................... 54Figure 6. Access to electricity, % households, 1997-2000 (most recent year) ..................... 58Figure 7. Electricity consumption per capita (kWh), 1997-2000 ......................................... 59Figure 8. Labour force participation (% economically active population), 2000-2001 ....... 62Figure 9. Unemployment (% economically active population), 2000-2001 ......................... 63Figure 10. Sources of income (%), 1999-2000 (most recent year) ......................................... 64Figure 11. Income disparities, 2000 ....................................................................................... 65Figure 12. Spatial distribution of poverty in LMB (%), 1997-1999 (most recent year) ........ 67Figure 13. Food poverty incidence in Cambodia, Lao PDR and Viet Nam (%),1993-1999 (most recent year) ............................................................................... 686. Macroeconomic Trends in the Lower Mekong Basin ......................................................... 85Figure 1. Sector share of employment and GDP, Cambodia ................................................ 87Figure 2. Sector share of employment and GDP, Lao PDR ................................................. 88Figure 3. Sector share of employment and GDP, Viet Nam ................................................. 90Figure 4. Sector share of employment and GDP, Thailand .................................................. 917. Fisheries................................................................................................................................ 101Table 1. Estimated freshwater fish and aquatic product consumption in theLower Mekong Basin ..........................................................................................108Table 2. Fish production and value in the LMB ................................................................. 110Table 3. Species composition and value of the ten most commonfish species groups in the 1995/1996 catch, by type of fishery,around the Great Lake and the Tonle Sap River ..................................................111Table 4. Fish species that disappeared from the catch downstream in theNam Song River in Lao PDR after completion of the diversion weir ................. 113Table 5. Freshwater aquaculture production in the LMB (based on latest availablestatistics 1997-2001) ........................................................................................... 121Figure 1. Generalised life cycle of migratory Mekong fishes, in relation toseasonal conditions. ............................................................................................. 102Figure 2. Relationship between the maximum flood level of the season andthe fish catch of the dai or bagnet fishery in the Tonle Sap River. ..................... 104Figure 3. Illustration of the fishing-down process .............................................................. 1168. Agriculture ........................................................................................................................... 145Table 1. Contribution of agriculture and forestry to GDP ................................................ 146Table 2. Contribution of agriculture and forestry to LMB country exports ..................... 146Table 3. Land use in the Lower Mekong Basin in 1997 ................................................... 148Table 4. Irrigated areas in the Mekong River Basin, 2001 ................................................153viii