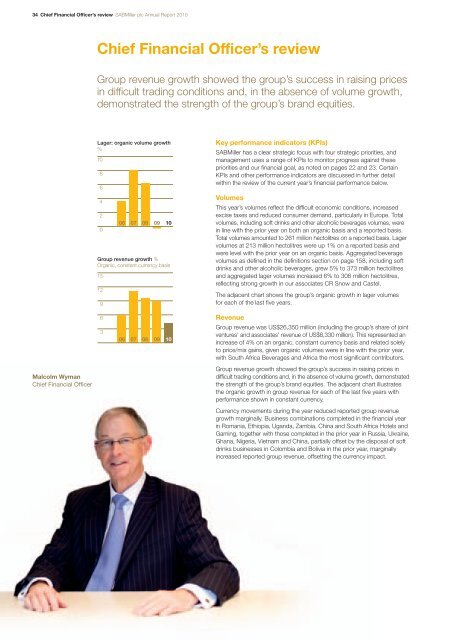
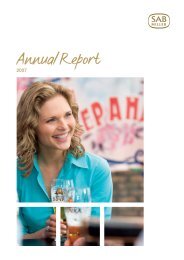
34 Chief Financial Officer’s review <strong>SABMiller</strong> plc <strong>Annual</strong> <strong>Report</strong> 2010Chief Financial Officer’s reviewGroup revenue growth showed the group’s success in raising pricesin difficult trading conditions and, in the absence of volume growth,demonstrated the strength of the group’s brand equities.Lager: organic volume growth%108642006 07 08 09 10Group revenue growth %Organic, constant currency basis15129Key performance indicators (KPIs)<strong>SABMiller</strong> has a clear strategic focus with four strategic priorities, andmanagement uses a range of KPIs to monitor progress against thesepriorities and our financial goal, as noted on pages 22 and 23. CertainKPIs and other performance indicators are discussed in further detailwithin the review of the current year’s financial performance below.VolumesThis year’s volumes reflect the difficult economic conditions, increasedexcise taxes and reduced consumer demand, particularly in Europe. Totalvolumes, including soft drinks and other alcoholic beverages volumes, werein line with the prior year on both an organic basis and a reported basis.Total volumes amounted to 261 million hectolitres on a reported basis. Lagervolumes at 213 million hectolitres were up 1% on a reported basis andwere level with the prior year on an organic basis. Aggregated beveragevolumes as defined in the definitions section on page 158, including softdrinks and other alcoholic beverages, grew 5% to 373 million hectolitresand aggregated lager volumes increased 6% to 308 million hectolitres,reflecting strong growth in our associates CR Snow and Castel.The adjacent chart shows the group’s organic growth in lager volumesfor each of the last five years.Malcolm WymanChief Financial Officer6306 07 08 09 10RevenueGroup revenue was US$26,350 million (including the group’s share of jointventures’ and associates’ revenue of US$8,330 million). This represented anincrease of 4% on an organic, constant currency basis and related solelyto price/mix gains, given organic volumes were in line with the prior year,with South Africa Beverages and Africa the most significant contributors.Group revenue growth showed the group’s success in raising prices indifficult trading conditions and, in the absence of volume growth, demonstratedthe strength of the group’s brand equities. The adjacent chart illustratesthe organic growth in group revenue for each of the last five years withperformance shown in constant currency.Currency movements during the year reduced reported group revenuegrowth marginally. Business combinations completed in the financial yearin Romania, Ethiopia, Uganda, Zambia, China and South Africa Hotels andGaming, together with those completed in the prior year in Russia, Ukraine,Ghana, Nigeria, Vietnam and China, partially offset by the disposal of softdrinks businesses in Colombia and Bolivia in the prior year, marginallyincreased reported group revenue, offsetting the currency impact.
<strong>SABMiller</strong> plc <strong>Annual</strong> <strong>Report</strong> 2010 Chief Financial Officer’s review 35In the past five years, the group has grown group revenuestrongly, both on an organic basis and by acquisition. Thecompound annual organic growth rate in volumes has been3.8% (2009: 4.6%). The group has leveraged volume growththrough price and mix benefits to generate compoundannual group revenue growth of 7.9% (2009: 8.6%) overthat period.The reduction in reported revenue to US$18,020 millionfrom US$18,703 million is due primarily to the effect ofthe formation of the MillerCoors joint venture at the endof the first quarter of the prior year and resultant exclusionof the group’s share of MillerCoors’ revenue from thereported statutory measure of revenue from that date.Input costsThe rate of raw material input cost increases eased overthe past year, following two years of significant commoditycost increases. Full-year raw material input costs were uplow single digits on the prior year, on a constant currencydollar per hectolitre basis. The rate of growth in raw materialcost increases slowed further in the last six months ofthe year, as the group benefited from lower brewing rawmaterials prices in most of our markets. In addition, lowerdistribution costs throughout the year, which were drivenby lower international oil prices and some distributionefficiencies, benefited overall cost of goods sold (COGS).However, these benefits within COGS were more thanoffset by higher sugar and glass prices.Local raw material costs were driven up in most regionsby both the weakening of some local currencies, as wellas forward exchange positions in other markets taken outat rates less favourable than foreign exchange rates thatprevailed during the year.Total COGS was up low single digits in the year, followinga 12% increase last year. The increase in COGS slowedin the second half of the year as the group benefited fromsome commodity cost reductions as supplier contractarrangements and hedged positions rolled off.The group expects raw material input costs to be levelto marginally lower in the forthcoming financial year. Thebenefits of lower brewing raw material costs, in particularreduced barley and hop prices, and lower distributioncosts, are expected to be largely offset by higher sugarand packaging raw material costs. In addition, localcurrency strength over the last six months has enabledcertain markets to lock in forward exchange contracts atrates more favourable than those that previously prevailed.EBITAThe group reports EBITA in its results in order to accordwith the manner in which the group is managed andperformance is evaluated. Segmental performance isreported after the apportionment of attributable headoffice service costs.EBITA growth %Organic, constant currency basis151296306 07 08 09 10EBITA margin performance %Organic, constant currency basis403224168The chart below shows the organic increase in EBITA foreach of the last five years with each year’s performanceshown in constant currency. EBITA grew 6% on anorganic, constant currency basis. <strong>Report</strong>ed EBITA atUS$4,381 million, which includes the impact of currencymovements, acquisitions and disposals, also grew 6%compared with the prior year. The adverse impact onEBITA of currency weakness in Europe and Africa wasmore than offset by currency strength in South Africaand to a lesser extent Latin America and Asia.All divisions recorded growth compared to the prior yearin organic, constant currency EBITA with the exception ofAsia which was level and South Africa Hotels and Gaming.EBITA marginThe group improved EBITA margin on an organic,constant currency basis, which at 16.7% was 30 bpshigher than the prior year, and this recovered part of thedecline suffered in the prior year caused by higher inputcosts. Cost efficiencies in Latin America, Europe andNorth America were the key contributors to the improvedEBITA margin. The chart below shows EBITA margin onan organic, constant currency basis by division.The group’s EBITA margin on a reported basis was 10 bpslower than EBITA on an organic, constant currency basis,due to lower margins earned in acquired businesses.Exceptional itemsItems that are material either by size or incidence areclassified as exceptional items. Further details on thetreatment of these items can be found in note 4 to theconsolidated financial statements.Net exceptional charges of US$490 million beforefinance costs and tax were reported during the year(2009: US$89 million) including net exceptional charges ofUS$18 million (2009: US$91 million) related to the group’sshare of joint ventures’ and associates’ exceptional charges.The net exceptional charges included US$325 millionrelated to business capability programme costs in LatinAmerica, Europe, Africa, South Africa Beverages andCorporate, US$78 million related to integration andrestructuring costs in Latin America and Europe, US$45million related to the impairment of property, plant andequipment in Latin America and US$24 million related totransaction costs in South Africa Beverages and Corporate.Within net finance costs there was an exceptionalcharge of US$17 million related to the business capabilityprogramme (2009: US$20 million exceptional creditrelated to the early termination of financial derivatives).The group’s share of joint ventures’ and associates’exceptional items in the year included US$14 million (2009:US$33 million) related to the group’s share of MillerCoors’integration and restructuring costs and US$4 million (2009:US$13 million) related to the group’s share of the unwindingof fair value adjustments on inventory in MillerCoors.09 10 09 10 09 10 09 10 09 10 09 10 09 10 09 10LatinAmericaEuropeNorthAmericaAfrica Asia South Africa Hotels &Beverages GamingGroupOverview Business reviewGovernance Financial statements Shareholder information