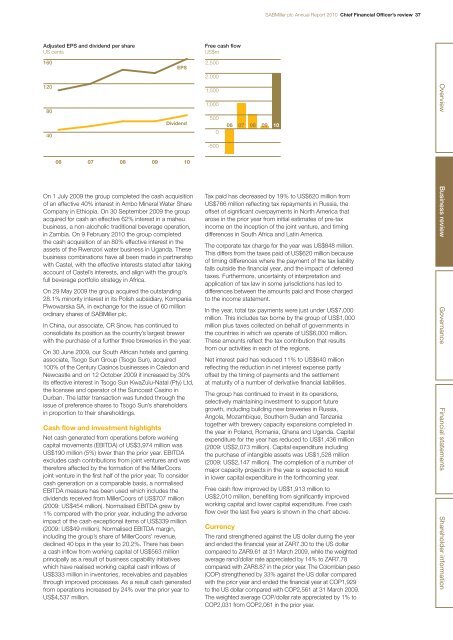
36 Chief Financial Officer’s review <strong>SABMiller</strong> plc <strong>Annual</strong> <strong>Report</strong> 2010Chief Financial Officer’s review continuedFree cash flow improved to US$2,010 millionbenefiting from significantly improved workingcapital and lower capital expenditure.In 2009 net exceptional charges of US$89 millionbefore finance costs and tax were reported, includingnet exceptional charges of US$91 million related tothe group’s share of joint ventures’ and associates’exceptional charges. The net exceptional chargesincluded US$110 million related to integration andrestructuring costs in Latin America, Europe andNorth America, US$392 million related to impairmentsin Europe, US$9 million related to the unwinding of fairvalue adjustments on inventory related to the acquisitionof Grolsch, and US$13 million in relation to litigation inLatin America, partially offset by a US$437 million profiton the deemed disposal of 42% of the US and PuertoRico operations of Miller and a US$89 million profit onthe disposal of soft drinks businesses in Colombia andBolivia. The group’s share of joint ventures’ and associates’exceptional items included, in addition to the amountsnoted above, charges of US$38 million related to thegroup’s share of the impairment of the Sparks brand inMillerCoors and US$7 million related to the group’s shareof fair value mark to market losses on financial instrumentsin Tsogo Sun.In addition to the exceptional costs charged to the incomestatement in the year as noted above, US$95 millionof intangible assets and property, plant and equipmenthas been capitalised to date in relation to the businesscapability programme. While the programme is still in itsinitial phase, it has already led to an improvement in workingcapital of US$333 million, together with US$17 million ofother savings.Finance costs and taxNet finance costs were US$563 million, a 20% decreaseon the prior year’s US$706 million, reflecting lower interestrates. Finance costs in the current year included a netloss of US$8 million (2009: US$27 million) from the mark tomarket adjustments of various derivatives on capital itemsfor which hedge accounting cannot be applied. Financecosts in the year also included a charge of US$17 millionin relation to the business capability programme (2009:gain of US$20 million on the early termination of financialderivatives). The mark to market loss and the businesscapability programme charge have been excluded fromthe determination of adjusted finance costs and adjustedearnings per share. Adjusted net finance costs wereUS$538 million, down 23%. Interest cover, as definedon page 158 in the definitions section, has increasedto 8.7 times from 6.6 times in the prior year.The effective rate of tax for the year before amortisationof intangible assets (other than software) and exceptionalitems was 28.5% compared to a rate of 30.2% in the prioryear. This reduction in the rate results from a combinationof factors, including the following:■ more favourable geographic mix of profits betweendifferent territories;■ ongoing tax efficiency measures; and■ releases of some tax provisions in Latin America andRussia following the satisfactory resolution of certaintax matters.The UK Government has introduced senior accountingofficer (SAO) legislation. The SAO will be personallyresponsible for certifying that the underlying systems areadequate for the purpose of calculating the tax liability.We have reviewed our tax processes and believe that ourexisting systems and controls are sufficient for this purpose.Profit and earningsAdjusted profit before tax of US$3,803 million increasedby 12% over the prior year primarily as a result of strongerpricing, cost efficiencies and lower finance costs. On astatutory basis, profit before tax of US$2,929 million was1% lower, reflecting the impact of exceptional items andthe adjustments to net finance costs as noted above.The group presents the measure of adjusted basic earningsper share, which excludes the impact of amortisation ofintangible assets (other than software), certain non-recurringitems and post-tax exceptional items, in order to presentan additional measure of underlying performance for theyears shown in the consolidated financial statements.Adjusted earnings increased by 22% to US$2,509 millionand the weighted average number of basic shares inissue for the year was 1,558 million, up from last year’s1,502 million. The increase in the weighted number ofbasic shares in issue resulted from the issue of 60 millionshares in May 2009 for the acquisition of the minorityinterests in our Polish business, together with the exerciseof share options during the year.Adjusted earnings per share were 17% higher at 161.1 UScents. Adjusted earnings per share also showed increaseswhen measured in rand and sterling. A reconciliationof the statutory measure of profit attributable to equityshareholders to adjusted earnings is shown in note 8to the consolidated financial statements. On a statutorybasis, basic earnings per share were 2% lower primarilyas a result of higher exceptional charges in the year.DividendsThe board has proposed a final dividend of 51 US centsto make a total of 68 US cents per share for the year –an increase of 17% from the prior year. This represents adividend cover of 2.4 times based on adjusted earningsper share, as described above (2009: 2.4 times). Thegroup’s guideline is to achieve dividend cover of between2.0 and 2.5 times adjusted earnings. The relationshipbetween the growth in dividends and adjusted earnings pershare is demonstrated in the chart on page 37. Details ofpayment dates and related matters are disclosed in thedirectors’ report.Business combinations and acquisitionsOn 10 April 2009 the group assumed control of a 70.56%interest in Bere Azuga SA in Romania following receiptof clearance from the competition authorities and hasconsolidated Bere Azuga from this date. Subsequently,further share purchases were made for cash, togetherwith a mandatory public offer for the remainder of sharesin Bere Azuga. As at 31 March 2010, Bere Azuga waswholly owned. The brewing operations of Bere Azugahave been transferred into the group’s other Romanianoperation, Ursus Breweries SA.
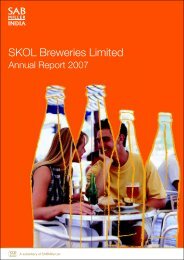
<strong>SABMiller</strong> plc <strong>Annual</strong> <strong>Report</strong> 2010 Chief Financial Officer’s review 37Adjusted EPS and dividend per shareUS cents1601208040EPSDividend06 07 08 09 10On 1 July 2009 the group completed the cash acquisitionof an effective 40% interest in Ambo Mineral Water ShareCompany in Ethiopia. On 30 September 2009 the groupacquired for cash an effective 62% interest in a maheubusiness, a non-alcoholic traditional beverage operation,in Zambia. On 9 February 2010 the group completedthe cash acquisition of an 80% effective interest in theassets of the Rwenzori water business in Uganda. Thesebusiness combinations have all been made in partnershipwith Castel, with the effective interests stated after takingaccount of Castel’s interests, and align with the group’sfull beverage portfolio strategy in Africa.On 29 May 2009 the group acquired the outstanding28.1% minority interest in its Polish subsidiary, KompaniaPiwowarska SA, in exchange for the issue of 60 millionordinary shares of <strong>SABMiller</strong> plc.In China, our associate, CR Snow, has continued toconsolidate its position as the country’s largest brewerwith the purchase of a further three breweries in the year.On 30 June 2009, our South African hotels and gamingassociate, Tsogo Sun Group (Tsogo Sun), acquired100% of the Century Casinos businesses in Caledon andNewcastle and on 12 October 2009 it increased by 30%its effective interest in Tsogo Sun KwaZulu-Natal (Pty) Ltd,the licensee and operator of the Suncoast Casino inDurban. The latter transaction was funded through theissue of preference shares to Tsogo Sun’s shareholdersin proportion to their shareholdings.Cash flow and investment highlightsNet cash generated from operations before workingcapital movements (EBITDA) of US$3,974 million wasUS$190 million (5%) lower than the prior year. EBITDAexcludes cash contributions from joint ventures and wastherefore affected by the formation of the MillerCoorsjoint venture in the first half of the prior year. To considercash generation on a comparable basis, a normalisedEBITDA measure has been used which includes thedividends received from MillerCoors of US$707 million(2009: US$454 million). Normalised EBITDA grew by1% compared with the prior year, including the adverseimpact of the cash exceptional items of US$339 million(2009: US$49 million). Normalised EBITDA margin,including the group’s share of MillerCoors’ revenue,declined 40 bps in the year to 20.2%. There has beena cash inflow from working capital of US$563 millionprincipally as a result of business capability initiativeswhich have realised working capital cash inflows ofUS$333 million in inventories, receivables and payablesthrough improved processes. As a result cash generatedfrom operations increased by 24% over the prior year toUS$4,537 million.Free cash flowUS$m2,5002,0001,5001,0005000-50006 07 08 09 10Tax paid has decreased by 19% to US$620 million fromUS$766 million reflecting tax repayments in Russia, theoffset of significant overpayments in North America thatarose in the prior year from initial estimates of pre-taxincome on the inception of the joint venture, and timingdifferences in South Africa and Latin America.The corporate tax charge for the year was US$848 million.This differs from the taxes paid of US$620 million becauseof timing differences where the payment of the tax liabilityfalls outside the financial year, and the impact of deferredtaxes. Furthermore, uncertainty of interpretation andapplication of tax law in some jurisdictions has led todifferences between the amounts paid and those chargedto the income statement.In the year, total tax payments were just under US$7,000million. This includes tax borne by the group of US$1,000million plus taxes collected on behalf of governments inthe countries in which we operate of US$6,000 million.These amounts reflect the tax contribution that resultsfrom our activities in each of the regions.Net interest paid has reduced 11% to US$640 millionreflecting the reduction in net interest expense partlyoffset by the timing of payments and the settlementat maturity of a number of derivative financial liabilities.The group has continued to invest in its operations,selectively maintaining investment to support futuregrowth, including building new breweries in Russia,Angola, Mozambique, Southern Sudan and Tanzaniatogether with brewery capacity expansions completed inthe year in Poland, Romania, Ghana and Uganda. Capitalexpenditure for the year has reduced to US$1,436 million(2009: US$2,073 million). Capital expenditure includingthe purchase of intangible assets was US$1,528 million(2009: US$2,147 million). The completion of a number ofmajor capacity projects in the year is expected to resultin lower capital expenditure in the forthcoming year.Free cash flow improved by US$1,913 million toUS$2,010 million, benefiting from significantly improvedworking capital and lower capital expenditure. Free cashflow over the last five years is shown in the chart above.CurrencyThe rand strengthened against the US dollar during the yearand ended the financial year at ZAR7.30 to the US dollarcompared to ZAR9.61 at 31 March 2009, while the weightedaverage rand/dollar rate appreciated by 14% to ZAR7.78compared with ZAR8.87 in the prior year. The Colombian peso(COP) strengthened by 33% against the US dollar comparedwith the prior year and ended the financial year at COP1,929to the US dollar compared with COP2,561 at 31 March 2009.The weighted average COP/dollar rate appreciated by 1% toCOP2,031 from COP2,061 in the prior year.Overview Business reviewGovernance Financial statements Shareholder information