Annual Report - SABMiller
Annual Report - SABMiller
Annual Report - SABMiller
- No tags were found...

Create successful ePaper yourself
Turn your PDF publications into a flip-book with our unique Google optimized e-Paper software.
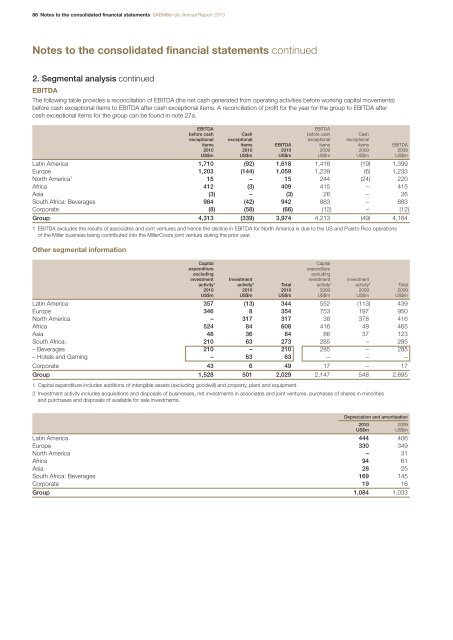
86 Notes to the consolidated financial statements <strong>SABMiller</strong> plc <strong>Annual</strong> <strong>Report</strong> 2010Notes to the consolidated financial statements continued2. Segmental analysis continuedEBITDAThe following table provides a reconciliation of EBITDA (the net cash generated from operating activities before working capital movements)before cash exceptional items to EBITDA after cash exceptional items. A reconciliation of profit for the year for the group to EBITDA aftercash exceptional items for the group can be found in note 27a.EBITDAEBITDAbefore cash Cash before cash Cashexceptional exceptional exceptional exceptionalitems items EBITDA items items EBITDA2010 2010 2010 2009 2009 2009US$m US$m US$m US$m US$m US$mLatin America 1,710 (92) 1,618 1,418 (19) 1,399Europe 1,203 (144) 1,059 1,239 (6) 1,233North America 1 15 – 15 244 (24) 220Africa 412 (3) 409 415 – 415Asia (3) – (3) 26 – 26South Africa: Beverages 984 (42) 942 883 – 883Corporate (8) (58) (66) (12) – (12)Group 4,313 (339) 3,974 4,213 (49) 4,1641 EBITDA excludes the results of associates and joint ventures and hence the decline in EBITDA for North America is due to the US and Puerto Rico operationsof the Miller business being contributed into the MillerCoors joint venture during the prior year.Other segmental informationCapitalCapitalexpenditureexpenditureexcludingexcludinginvestment Investment investment Investmentactivity 1 activity 2 Total activity 1 activity 2 Total2010 2010 2010 2009 2009 2009US$m US$m US$m US$m US$m US$mLatin America 357 (13) 344 552 (113) 439Europe 346 8 354 753 197 950North America – 317 317 38 378 416Africa 524 84 608 416 49 465Asia 48 36 84 86 37 123South Africa: 210 63 273 285 – 285– Beverages 210 – 210 285 – 285– Hotels and Gaming – 63 63 – – –Corporate 43 6 49 17 – 17Group 1,528 501 2,029 2,147 548 2,6951 Capital expenditure includes additions of intangible assets (excluding goodwill) and property, plant and equipment.2 Investment activity includes acquisitions and disposals of businesses, net investments in associates and joint ventures, purchases of shares in minoritiesand purchases and disposals of available for sale investments.Depreciation and amortisation2010 2009US$mUS$mLatin America 444 406Europe 330 349North America – 31Africa 94 61Asia 28 25South Africa: Beverages 169 145Corporate 19 16Group 1,084 1,033