- Page 1:
Pile Setup, Dynamic Construction Co
- Page 5:
v2.5.8. Soil profile input procedur
- Page 8 and 9:
viii6.2. Introduction .............
- Page 10 and 11:
xLIST OF FIGURESFigure 2.1: Typical
- Page 12 and 13:
xiiresistances using the proposed p
- Page 14 and 15:
xivLIST OF TABLESTable 2.1: Summary
- Page 16 and 17:
xviABSTRACTBecause of the mandate i
- Page 18 and 19:
xviiiFurthermore, using these calib
- Page 20 and 21:
2soil strength. The gain in effecti
- Page 22 and 23:
4check pile integrity; (5) evaluate
- Page 24 and 25:
6confidently accounted for in curre
- Page 26 and 27:
8Board (IHRB) sponsored research pr
- Page 28 and 29:
10collected undisturbed soil sample
- Page 30:
12correction factors to estimated p
- Page 33 and 34:
15Chapter 7 - An Improved CAPWAP Ma
- Page 35 and 36:
17Procedures and Models Version 200
- Page 37 and 38:
19Section 2.8.2.2. Historical Summa
- Page 39 and 40:
21A = pile cross sectional area at
- Page 41 and 42:
23compressive force pulse expands d
- Page 43 and 44:
25When a uniform free end rod is im
- Page 45 and 46:
27RTLR sC vJ cv b= total soil resis
- Page 47 and 48:
29For a pile with very hard driving
- Page 49 and 50:
Force∆R∆u31( )(2.12)where,BTA =
- Page 51 and 52:
33Hammer efficiency defines the per
- Page 53 and 54:
35ForceMinimal Shaft ResistanceMini
- Page 55 and 56:
372.4. Case Pile Wave Analysis Prog
- Page 57 and 58:
39computation is stable only when t
- Page 59 and 60:
41,( ) ( ) - (2.17)( ) ( ) ( ) (2.1
- Page 61 and 62:
43been carried by many researchers
- Page 63 and 64:
Table 2.5: Summary 2 of dynamic soi
- Page 65 and 66:
472.4.3.1. Pile modelPile Dynamics,
- Page 67 and 68:
49Pile Segment iSoil Segment kJ kR
- Page 69 and 70:
̇̇̇̇51= pile bottom velocity at
- Page 71 and 72:
534. Constant dynamic soil paramete
- Page 73 and 74:
(a) Schematic (b) ModelExternal Com
- Page 75 and 76:
572.5.4. Pile modelPile model is di
- Page 77 and 78:
59model calculates the dynamic soil
- Page 79 and 80:
61where,a ij= acceleration at a pil
- Page 81 and 82:
Table 2.6: Summary of static analys
- Page 83 and 84:
65Table 2.9: Empirical values for
- Page 85 and 86:
Ultimate Capacity (kips)Stroke (ft)
- Page 87 and 88:
69blows/ft) or less is required to
- Page 89 and 90:
71methods is obscure and it cannot
- Page 91 and 92:
73Case Reference Pile type7891011Le
- Page 93 and 94:
75Case Reference Pile type910111213
- Page 95 and 96:
77Case Reference Pile type192021222
- Page 97 and 98:
79Case Reference Pile type333435363
- Page 99 and 100:
Days (Ahead)/DelayFigure 2.15: A gr
- Page 101 and 102:
83construction procedures used by t
- Page 103 and 104:
85f(g)βσ gFailure RegionArea = p
- Page 105 and 106:
87Table 2.14: AASHTO assumed random
- Page 107 and 108:
89(2.47)( ) ( ) (2.48)( ) ( ) (2.49
- Page 109 and 110:
912.7.4 Recommended LRFD resistance
- Page 111 and 112:
932.8. Pile Setup2.8.1 Introduction
- Page 113 and 114:
Ratio of Final to Initial Pile Resi
- Page 115 and 116:
97be determined. The challenges wit
- Page 117 and 118:
99Based on about 70 test piles at m
- Page 119 and 120:
101Komurka et al. (2003) noted that
- Page 121 and 122:
103developed by Wathugala and Desai
- Page 123 and 124:
105dynamic analysis methods. They s
- Page 125 and 126: 107Factors for LRFD Foundation Stre
- Page 127 and 128: 109New Jersey.Coyle, H. M, Bartoske
- Page 129 and 130: 111Hannigan, P. J. and Webster, S.
- Page 131 and 132: 113Theory to Piles, Petaling Jaya,
- Page 133 and 134: 115PDCA Specification 102-07, PDCA
- Page 135 and 136: 117Soderberg, L. O. (1962). ―Cons
- Page 137 and 138: 119Driven Piles in Clay.‖ Canadia
- Page 139 and 140: 1213.2. IntroductionMany researcher
- Page 141 and 142: 123with CAPWAP analysis at differen
- Page 143 and 144: 125Disturbed soil samples were coll
- Page 145 and 146: 1273.4.3. InstrumentationAll test p
- Page 147 and 148: 129embedded length before and after
- Page 149 and 150: 131(R EOD ) from CAPWAP analyses. T
- Page 151 and 152: 133due to restrike and SLT as well
- Page 153 and 154: 1353.5.6. Quantitative studies betw
- Page 155 and 156: 1373. The experimental investigatio
- Page 157 and 158: 139Geotechnical Special Publication
- Page 159 and 160: abcTable 3.1: Summary of soil profi
- Page 161 and 162: TestpileISU2ISU3ISU4ISU5ISU6HammerD
- Page 163 and 164: 1453.02.82.6Reported Soil Informati
- Page 165 and 166: Vertical Coefficient of Consolidati
- Page 167 and 168: Depth Below Ground (m)Depth Below G
- Page 169 and 170: Percent Increase in Total Resistanc
- Page 171 and 172: Depth Below Ground (m)Depth Below G
- Page 173 and 174: 155CHAPTER 4: PILE SETUP IN COHESIV
- Page 175: 157proposed pile setup method in a
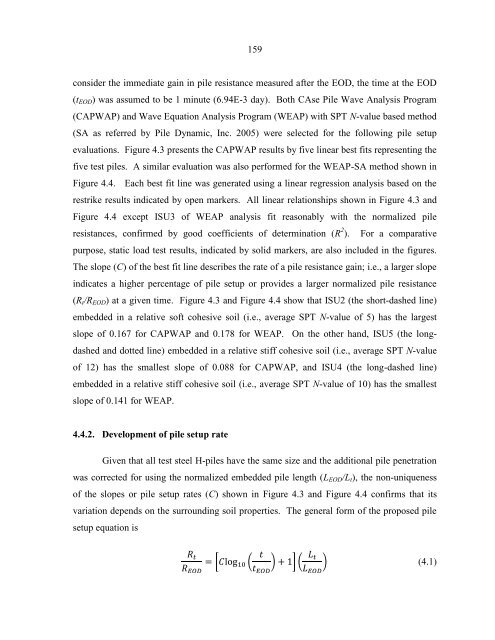
- Page 179 and 180: 161companion paper also show that p
- Page 181 and 182: 1632. Accounting for the actual tim
- Page 183 and 184: 165were compared using the proposed
- Page 185 and 186: 167(17 ft) well-graded sand (SW) an
- Page 187 and 188: 169( )√ ( ) √ (4.10)where μ =
- Page 189 and 190: 1714.8. Integration of Pile Setup I
- Page 191 and 192: 173diameter smaller than 600 mm). F
- Page 193 and 194: Pile Resistance (kN)175geotechnical
- Page 195 and 196: 177R m , R t = Measured pile resist
- Page 197 and 198: 179Field Testing of Steel Piles in
- Page 199 and 200: 181Table 4.1: Summary of existing m
- Page 201 and 202: Table 4.3: Summary of five external
- Page 203 and 204: 183Soil LayerTable 4.5: Soil inform
- Page 205 and 206: (R t /R EOD ) × (L EOD /L t )(R t
- Page 207 and 208: Measured Pile Resistance (kN)Measur
- Page 209 and 210: 189Measured Pile Resistance at Time
- Page 211 and 212: Ratio of Measured and Predicted Pil
- Page 213 and 214: 193surrounding the pile and the con
- Page 215 and 216: 195Method (FORM) to calculate resis
- Page 217 and 218: 197estimated using Eq. (5.1a), was
- Page 219 and 220: 199Table 5.2: Comparison of Resista
- Page 221 and 222: Percent201E(g) = expected value or
- Page 223 and 224: 203( ( )) ( ̅) ( ) (5.7)( ) ( ) (5
- Page 225 and 226: 205φ setup values. At a fixed dead
- Page 227 and 228:
207conditions and design practices,
- Page 229 and 230:
209procedure in pile designs. Two c
- Page 231 and 232:
211estimation methods (e.g. Skov an
- Page 233 and 234:
213End-Of-Drive and Set-up Componen
- Page 235 and 236:
215CHAPTER 6: INTEGRATION OF CONSTR
- Page 237 and 238:
217Bridge Design Specifications hav
- Page 239 and 240:
219Chapter 5. The resistance factor
- Page 241 and 242:
2216.4.3. Calibration methodFirst-O
- Page 243 and 244:
223The LRFD resistance factors cali
- Page 245 and 246:
225a. For sand and mixed soil profi
- Page 247 and 248:
227for the Iowa Blue Book. To evalu
- Page 249 and 250:
229Book method computed by AbdelSal
- Page 251 and 252:
231modified resistance factor (Пξ
- Page 253 and 254:
233Furthermore, these LRFD recommen
- Page 255 and 256:
235Revisions, Washington, D.C.Abdel
- Page 257 and 258:
Table 6.1: Summary of data records
- Page 259 and 260:
Testpile IDISU1ISU2ISU3ISU4ISU5ISU6
- Page 261 and 262:
Table 6.4: Summary of adjusted meas
- Page 263 and 264:
243SourceIowaNCHRPReport 507Soilpro
- Page 265 and 266:
PercentPercent2459990501010.10.2STI
- Page 267 and 268:
PercentPercent2479990501010.51.0STI
- Page 269 and 270:
PercentWEAP over Blue Book with Con
- Page 271 and 272:
2517.2. IntroductionAlthough dynami
- Page 273 and 274:
253difficulty in pile setup investi
- Page 275 and 276:
255Liang (2000) calculated an avera
- Page 277 and 278:
257model shown in Figure 7.1. Based
- Page 279 and 280:
259which were identified as ISU2, I
- Page 281 and 282:
261figure, a power relationship in
- Page 283 and 284:
263relationship between the f s val
- Page 285 and 286:
2657.5.4. EOD condition for cohesio
- Page 287 and 288:
267were plotted against the SPT N-v
- Page 289 and 290:
269correlation between dynamic soil
- Page 291 and 292:
271Application of Stress-Wave Theor
- Page 293 and 294:
273Table 7.4: Summary of measured s
- Page 295 and 296:
275Table 7.5: Summary of measured s
- Page 297 and 298:
Soil Resistance (R)Soil DampingResi
- Page 299 and 300:
Upward Traveling Wave, W u (kN)F(t)
- Page 301 and 302:
Shaft Quake Value, qs (mm)Shaft Dam
- Page 303 and 304:
Depth Below Ground (m)Depth Below G
- Page 305 and 306:
Shaft Quake Value, q s (mm)Smith's
- Page 307 and 308:
Shaft Dampinf Factor, J s (s/m)Shaf
- Page 309 and 310:
289CHAPTER 8: SUMMARY, CONCLUSIONS
- Page 311 and 312:
291increased immediately and rapidl
- Page 313 and 314:
293improved. The regionally-calibra
- Page 315 and 316:
295relationship was conclusively dr
- Page 317:
297ACKNOWLEDGMENTSI was one of the


