Examiner's Manual & Technical Report - Kaplanco.com
Examiner's Manual & Technical Report - Kaplanco.com
Examiner's Manual & Technical Report - Kaplanco.com
- No tags were found...
You also want an ePaper? Increase the reach of your titles
YUMPU automatically turns print PDFs into web optimized ePapers that Google loves.
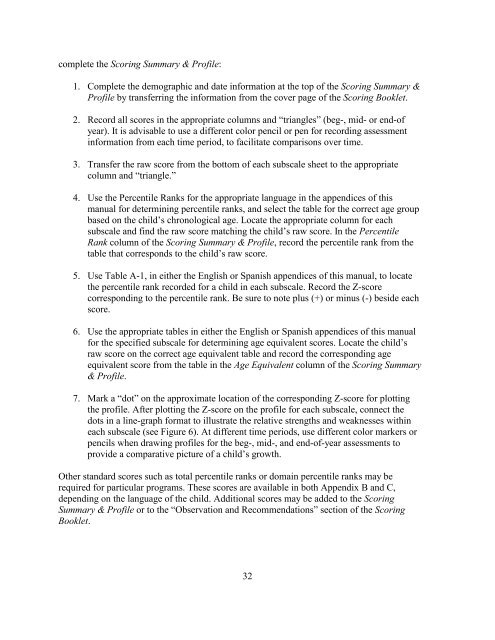
<strong>com</strong>plete the Scoring Summary & Profile:1. Complete the demographic and date information at the top of the Scoring Summary &Profile by transferring the information from the cover page of the Scoring Booklet.2. Record all scores in the appropriate columns and “triangles” (beg-, mid- or end-ofyear). It is advisable to use a different color pencil or pen for recording assessmentinformation from each time period, to facilitate <strong>com</strong>parisons over time.3. Transfer the raw score from the bottom of each subscale sheet to the appropriatecolumn and “triangle.”4. Use the Percentile Ranks for the appropriate language in the appendices of thismanual for determining percentile ranks, and select the table for the correct age groupbased on the child’s chronological age. Locate the appropriate column for eachsubscale and find the raw score matching the child’s raw score. In the PercentileRank column of the Scoring Summary & Profile, record the percentile rank from thetable that corresponds to the child’s raw score.5. Use Table A-1, in either the English or Spanish appendices of this manual, to locatethe percentile rank recorded for a child in each subscale. Record the Z-scorecorresponding to the percentile rank. Be sure to note plus (+) or minus (-) beside eachscore.6. Use the appropriate tables in either the English or Spanish appendices of this manualfor the specified subscale for determining age equivalent scores. Locate the child’sraw score on the correct age equivalent table and record the corresponding ageequivalent score from the table in the Age Equivalent column of the Scoring Summary& Profile.7. Mark a “dot” on the approximate location of the corresponding Z-score for plottingthe profile. After plotting the Z-score on the profile for each subscale, connect thedots in a line-graph format to illustrate the relative strengths and weaknesses withineach subscale (see Figure 6). At different time periods, use different color markers orpencils when drawing profiles for the beg-, mid-, and end-of-year assessments toprovide a <strong>com</strong>parative picture of a child’s growth.Other standard scores such as total percentile ranks or domain percentile ranks may berequired for particular programs. These scores are available in both Appendix B and C,depending on the language of the child. Additional scores may be added to the ScoringSummary & Profile or to the “Observation and Re<strong>com</strong>mendations” section of the ScoringBooklet.32


