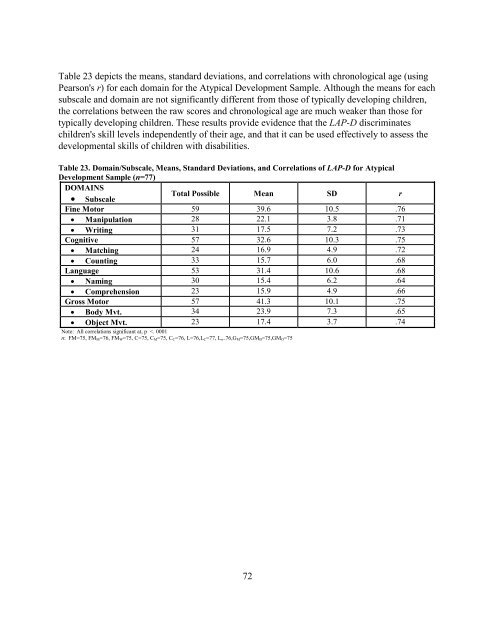
Table 23 depicts the means, standard deviations, and correlations with chronological age (usingPearson's r) for each domain for the Atypical Development Sample. Although the means for eachsubscale and domain are not significantly different from those of typically developing children,the correlations between the raw scores and chronological age are much weaker than those fortypically developing children. These results provide evidence that the LAP-D discriminateschildren's skill levels independently of their age, and that it can be used effectively to assess thedevelopmental skills of children with disabilities.Table 23. Domain/Subscale, Means, Standard Deviations, and Correlations of LAP-D for AtypicalDevelopment Sample (n=77)DOMAINS• SubscaleTotal Possible Mean SD rFine Motor 59 39.6 10.5 .76• Manipulation 28 22.1 3.8 .71• Writing 31 17.5 7.2 .73Cognitive 57 32.6 10.3 .75• Matching 24 16.9 4.9 .72• Counting 33 15.7 6.0 .68Language 53 31.4 10.6 .68• Naming 30 15.4 6.2 .64• Comprehension 23 15.9 4.9 .66Gross Motor 57 41.3 10.1 .75• Body Mvt. 34 23.9 7.3 .65• Object Mvt. 23 17.4 3.7 .74Note: All correlations significant at, p
Chapter 7Process for Developing Norming TablesThe present section describes the standardization sample, normative procedures, and LAP-D scores. Normative tables for the LAP-D are presented by six-month age groupings.Characteristics of the standardization sample of 2099 children were presented in Chapter 4.All normative tables are located in the Appendix.Table A-1 in Appendix A may be used to convert percentile ranks to normalized standardscores (z-scores, T -scores, and normal curve equivalents). For English-Speaking children,Tables B-1 to B-15 in Appendix B may be used to convert raw scores on the eight LAP-Dsubscales, four LAP-D domains, and total LAP-D to percentile ranks. One table is providedfor each one of seven age groups for subscales and again for domains. Tables B-16 to B-18provide the LAP-D age equivalent scores for the eight subscales, four domains, and totalLAP-D scores, also for English-Speaking children. For Spanish-speaking children, TablesC-1 to C-15 in Appendix C may be used to convert raw scores on the eight LAP-Dsubscales, four LAP-D domains, and total LAP-D to percentile ranks, and Tables C-16 to C-18 provide the LAP-D age equivalent scores for the eight subscales, four domains, and totalLAP-D scores.Percentile RanksThe percentile rank of a score is the percent of individuals in the standardization samplewho earned scores at or below the score in question. For example, a child who is 55 monthsold and obtains a Fine Motor: Manipulation (FM) raw score of 27 has a percentile rank of86. This indicates that 86% of the children in the standardization sample scored at or below27. Percentile ranks are particularly useful when interpreting scores to parents. Thus, it iseasy for a parent to understand a statement such as, "Your child's score of 27 was higherthan 86% of the children of his/her same age group in the standardization sample on FineMotor: Manipulation."Caution should be used when presenting scores as percentile ranks. Crocker & Algina(1986) note some misinterpretation results from the fact that percentile rank is a nonlineartransformation of the raw scores. As a result, differences between percentile ranks do notindicate equal-interval amounts of difference for the characteristic being measured. Forexample, if the percentile ranks of three children on the FM subscale are 70, 80, and 90,respectively, we can conclude that the third child's score is superior to that of thesecond, and the second child's score is superior to that of the first; but we cannot saythe difference between the first and second child is of the same magnitude as thedifference between the second and third.Users of the percentile rank tables should also be aware when interpreting results thatpercentile ranks are less stable toward the center of the score distribution than they areat the extremes. Therefore, a small difference in raw scores toward the center of thedistribution may translate into a larger percentile rank difference than would the samedifference at either of the extremes.73
- Page 3 and 4:
Initial DevelopmentDavid Wilson LeM
- Page 6 and 7:
About the AuthorsBelinda J. Hardin
- Page 8 and 9:
Interpreting LAP-D Profiles........
- Page 10 and 11:
validity, in English and Spanish?
- Page 12 and 13:
the LAP-D Third Edition is comprise
- Page 15 and 16:
Chapter 2Overview of the LAP-DThis
- Page 17 and 18:
egression procedures. This study ex
- Page 19 and 20:
Table 1. Subscales of the LAP-DDoma
- Page 21:
LAP-D Scoring Booklet. The Scoring
- Page 24 and 25:
ecomes inattentive or severely dist
- Page 26 and 27:
--When borrowing a month, borrow 30
- Page 28 and 29:
Determining Starting PointsOnce the
- Page 30 and 31: Scoring Procedures RulesOnce the st
- Page 32 and 33: Figure 3a. Determining the BasalJOR
- Page 34 and 35: Ceiling RulesThe child’s ceiling
- Page 36 and 37: Additional Scoring Rules1. Administ
- Page 38 and 39: Figure 5. Computing Raw ScoresDEVAG
- Page 40 and 41: complete the Scoring Summary & Prof
- Page 42 and 43: Figure 7: Shanika’s Scoring Summa
- Page 44 and 45: Figure 9: Alan’s Scoring Summary
- Page 46 and 47: Communicating Assessment Results to
- Page 48 and 49: of training and experience required
- Page 50 and 51: sessions, one to three weeks apart,
- Page 52 and 53: Changes were made to the translatio
- Page 54 and 55: 60-65 months 183 62.4 001.8 194 62.
- Page 56 and 57: Table 6. Adults and Number of Child
- Page 58 and 59: Prior to selection of the criterion
- Page 60 and 61: additional 409 children (19.5%; n=2
- Page 62 and 63: means, standard deviations, and cor
- Page 64 and 65: • Comprehension30-35 months 99 08
- Page 66 and 67: Table 12b. Internal Consistency of
- Page 68 and 69: Table 13b. Standard Errors of Measu
- Page 70 and 71: Test-retest reliability was determi
- Page 72 and 73: speaking children, 8.62% were Black
- Page 74 and 75: Table 17b. Means, Standard Deviatio
- Page 76 and 77: Table 18b. Zero-order Correlations
- Page 78 and 79: Table 20. Correlations Between LAP-
- Page 82 and 83: Age Equivalent ScoresAn age equival
- Page 85 and 86: ReferencesAmerican Educational Rese
- Page 87 and 88: Errata for theExaminer’s Manual &
- Page 89 and 90: Table A-1. Percentile Rank, NCE, t-
- Page 91 and 92: Table B-2. Percentile Ranks for LAP
- Page 93 and 94: Table B-4. Percentile Ranks for LAP
- Page 95 and 96: Table B-6. Percentile Ranks for LAP
- Page 97 and 98: Table B-8. Percentile Ranks for LAP
- Page 99 and 100: Table B-10. Percentile Ranks for LA
- Page 101 and 102: Table B-12. Percentile Ranks for LA
- Page 103 and 104: Table B-14. Percentile Ranks for LA
- Page 105 and 106: 30-35 MONTHS 36-41 MONTHS 42-47 MON
- Page 107 and 108: 30-35 MONTHS 36-41 MONTHS 42-47 MON
- Page 109 and 110: Table C-1. Percentile Ranks for LAP
- Page 111 and 112: Table C-3. Percentile Ranks for LAP
- Page 113 and 114: Table C-5. Percentile Ranks for LAP
- Page 115 and 116: Table C-7. Percentile Ranks for LAP
- Page 117 and 118: Table C-9. Percentile Ranks for LAP
- Page 119 and 120: Table C-11. Percentile Ranks for LA
- Page 121 and 122: Table C-13. Percentile Ranks for LA
- Page 123 and 124: Table C-15. Percentile Ranks for To
- Page 125: Table C-16. Spanish Age Equivalents