Download all Technical Policy Briefing Notes in a single ... - Mediation
Download all Technical Policy Briefing Notes in a single ... - Mediation
Download all Technical Policy Briefing Notes in a single ... - Mediation
- No tags were found...

Create successful ePaper yourself
Turn your PDF publications into a flip-book with our unique Google optimized e-Paper software.
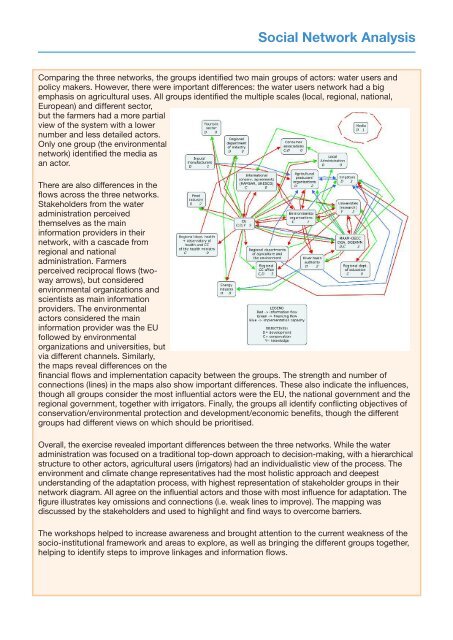
Social Network AnalysisCompar<strong>in</strong>g the three networks, the groups identified two ma<strong>in</strong> groups of actors: water users andpolicy makers. However, there were important differences: the water users network had a bigemphasis on agricultural uses. All groups identified the multiple scales (local, regional, national,European) and different sector,but the farmers had a more partialview of the system with a lowernumber and less detailed actors.Only one group (the environmentalnetwork) identified the media asan actor.There are also differences <strong>in</strong> theflows across the three networks.Stakeholders from the wateradm<strong>in</strong>istration perceivedthemselves as the ma<strong>in</strong><strong>in</strong>formation providers <strong>in</strong> theirnetwork, with a cascade fromregional and nationaladm<strong>in</strong>istration. Farmersperceived reciprocal flows (twowayarrows), but consideredenvironmental organizations andscientists as ma<strong>in</strong> <strong>in</strong>formationproviders. The environmentalactors considered the ma<strong>in</strong><strong>in</strong>formation provider was the EUfollowed by environmentalorganizations and universities, butvia different channels. Similarly,the maps reveal differences on thef<strong>in</strong>ancial flows and implementation capacity between the groups. The strength and number ofconnections (l<strong>in</strong>es) <strong>in</strong> the maps also show important differences. These also <strong>in</strong>dicate the <strong>in</strong>fluences,though <strong>all</strong> groups consider the most <strong>in</strong>fluential actors were the EU, the national government and theregional government, together with irrigators. F<strong>in</strong><strong>all</strong>y, the groups <strong>all</strong> identify conflict<strong>in</strong>g objectives ofconservation/environmental protection and development/economic benefits, though the differentgroups had different views on which should be prioritised.Over<strong>all</strong>, the exercise revealed important differences between the three networks. While the wateradm<strong>in</strong>istration was focused on a traditional top-down approach to decision-mak<strong>in</strong>g, with a hierarchicalstructure to other actors, agricultural users (irrigators) had an <strong>in</strong>dividualistic view of the process. Theenvironment and climate change representatives had the most holistic approach and deepestunderstand<strong>in</strong>g of the adaptation process, with highest representation of stakeholder groups <strong>in</strong> theirnetwork diagram. All agree on the <strong>in</strong>fluential actors and those with most <strong>in</strong>fluence for adaptation. Thefigure illustrates key omissions and connections (i.e. weak l<strong>in</strong>es to improve). The mapp<strong>in</strong>g wasdiscussed by the stakeholders and used to highlight and f<strong>in</strong>d ways to overcome barriers.The workshops helped to <strong>in</strong>crease awareness and brought attention to the current weakness of thesocio-<strong>in</strong>stitutional framework and areas to explore, as well as br<strong>in</strong>g<strong>in</strong>g the different groups together,help<strong>in</strong>g to identify steps to improve l<strong>in</strong>kages and <strong>in</strong>formation flows.