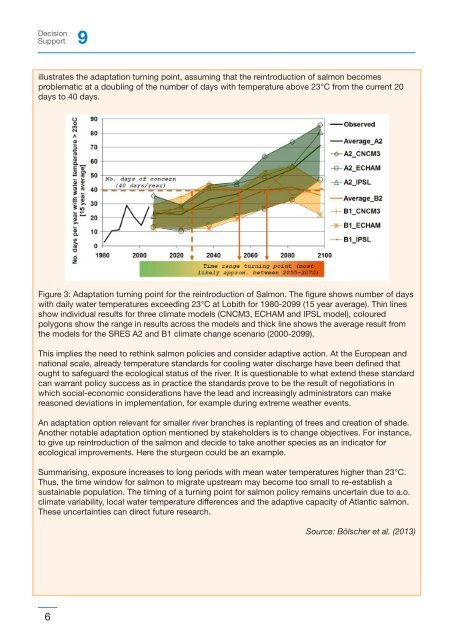
DecisionSupport 9illustrates the adaptation turn<strong>in</strong>g po<strong>in</strong>t, assum<strong>in</strong>g that the re<strong>in</strong>troduction of salmon becomesproblematic at a doubl<strong>in</strong>g of the number of days with temperature above 23°C from the current 20days to 40 days.Figure 3: Adaptation turn<strong>in</strong>g po<strong>in</strong>t for the re<strong>in</strong>troduction of Salmon. The figure shows number of dayswith daily water temperatures exceed<strong>in</strong>g 23°C at Lobith for 1980-2099 (15 year average). Th<strong>in</strong> l<strong>in</strong>esshow <strong>in</strong>dividual results for three climate models (CNCM3, ECHAM and IPSL model), colouredpolygons show the range <strong>in</strong> results across the models and thick l<strong>in</strong>e shows the average result fromthe models for the SRES A2 and B1 climate change scenario (2000-2099).This implies the need to reth<strong>in</strong>k salmon policies and consider adaptive action. At the European andnational scale, already temperature standards for cool<strong>in</strong>g water discharge have been def<strong>in</strong>ed thatought to safeguard the ecological status of the river. It is questionable to what extend these standardcan warrant policy success as <strong>in</strong> practice the standards prove to be the result of negotiations <strong>in</strong>which social-economic considerations have the lead and <strong>in</strong>creas<strong>in</strong>gly adm<strong>in</strong>istrators can makereasoned deviations <strong>in</strong> implementation, for example dur<strong>in</strong>g extreme weather events.An adaptation option relevant for sm<strong>all</strong>er river branches is replant<strong>in</strong>g of trees and creation of shade.Another notable adaptation option mentioned by stakeholders is to change objectives. For <strong>in</strong>stance,to give up re<strong>in</strong>troduction of the salmon and decide to take another species as an <strong>in</strong>dicator forecological improvements. Here the sturgeon could be an example.Summaris<strong>in</strong>g, exposure <strong>in</strong>creases to long periods with mean water temperatures higher than 23°C.Thus, the time w<strong>in</strong>dow for salmon to migrate upstream may become too sm<strong>all</strong> to re-establish asusta<strong>in</strong>able population. The tim<strong>in</strong>g of a turn<strong>in</strong>g po<strong>in</strong>t for salmon policy rema<strong>in</strong>s uncerta<strong>in</strong> due to a.o.climate variability, local water temperature differences and the adaptive capacity of Atlantic salmon.These uncerta<strong>in</strong>ties can direct future research.Source: Bölscher et al. (2013)6
Adaptation Turn<strong>in</strong>g Po<strong>in</strong>tsCase Study 2: Turn<strong>in</strong>g po<strong>in</strong>ts for w<strong>in</strong>e production <strong>in</strong> Tuscany, ItalySocial-political thresholds of <strong>in</strong>terestThis case study explores w<strong>in</strong>e production <strong>in</strong> Tuscany, Italy under climate change. W<strong>in</strong>e production <strong>in</strong>the region is progressively chang<strong>in</strong>g from mixed farm<strong>in</strong>g system to specialized viticulture. Part of thischange is the rediscovery and improvement of traditional and autochthonous v<strong>in</strong>es and a switch toquality production with lower yields, less chemicals and <strong>in</strong>creased value of produced w<strong>in</strong>e. Thenumber of v<strong>in</strong>e-grow<strong>in</strong>g farms has been reduced by half over the last 20 years, while average farmsize has <strong>in</strong>creased. Significantly, more than half of the total regional v<strong>in</strong>eyard surface is labelled asDesignation of Orig<strong>in</strong> (DO).The associations and unions <strong>in</strong> the region offer <strong>in</strong>centives <strong>in</strong> support of the above mentionedspecialisation. Regione Toscana encourages the renewal of old v<strong>in</strong>eyards, on the basis of farmersapplication and selection. Associations also create awareness that agriculture has created a uniquelandscape <strong>in</strong> Tuscany that is both productive and <strong>in</strong>ternation<strong>all</strong>y recognised for its beauty. The imageof the v<strong>in</strong>eyard, surrounded by the classic, quiet and clean Tuscan landscape, offers a competitiveadvantage for the w<strong>in</strong>e that is produced there. Thus, agriculture has both an economic, andenvironmental and landscape value <strong>in</strong> Tuscany. At the same time the strict landscape conservationand production rules can limit adaptation.Farmers <strong>in</strong> Tuscany already observe consequences of climate change and express an <strong>in</strong>creas<strong>in</strong>g<strong>in</strong>terest <strong>in</strong> adaptation. A key question is whether climate change will make farmers change grapevarieties, move to other locations or switch to other livelihoods. Here it is feared that changes <strong>in</strong>v<strong>in</strong>iculture could have detrimental effects on the landscape, and therefore on tourism and quality ofliv<strong>in</strong>g. After stakeholder consultation the ma<strong>in</strong> questions and thresholds of <strong>in</strong>terest are:• (when) does w<strong>in</strong>e production <strong>in</strong> its current form become unviable <strong>in</strong> the region?• (when) does adaptation become attractive?Farmers expressed an immediate <strong>in</strong>terest <strong>in</strong> two adaption strategies: mov<strong>in</strong>g production to higherelevations and chang<strong>in</strong>g to new varieties. These adaptive actions have a response time of at least 4-10years (the time it takes for a new w<strong>in</strong>e yard to become productive). Farmers and government representativesstress the crucial importance of assess<strong>in</strong>g w<strong>in</strong>e quality, rather than the more typic<strong>all</strong>y modelledproduction quantity, as the survival of Tuscan viticulture is strictly l<strong>in</strong>ked to its high-quality w<strong>in</strong>es.Climatic conditions for reach<strong>in</strong>g thresholdsFarmers already observe a strong relationship between an <strong>in</strong>crease <strong>in</strong> temperature and the reduction ofthe vegetative cycle of the v<strong>in</strong>e. The grapes are ripen<strong>in</strong>g earlier compared to twenty years ago, withconsequent advance of harvest operations. Literature f<strong>in</strong>ds improvement of w<strong>in</strong>e quality with ris<strong>in</strong>gtemperature at first, yet f<strong>all</strong><strong>in</strong>g beyond a certa<strong>in</strong> threshold, depend<strong>in</strong>g on variety. This corresponds witha shift <strong>in</strong> the area best suitable for grapev<strong>in</strong>e cultivation either to higher elevations or to higher latitudes.Adaptation turn<strong>in</strong>g po<strong>in</strong>ts and lessonsA farmer reaches an adaptation turn<strong>in</strong>g po<strong>in</strong>t the moment that w<strong>in</strong>e quality drops below a desiredquality or w<strong>in</strong>e of a higher quality can be produced at a higher elevation. To assess whether andwhen this may happen the study used a modell<strong>in</strong>g framework for <strong>in</strong>vestigat<strong>in</strong>g climate changeimpacts on viticulture <strong>in</strong> the Tuscany region (Moriondo et al., 2011). Downscaled climate data(temperature, precipitation and CO 2level from observations and the IPCC SRES scenarios A2 andB2 from different climate models) are <strong>in</strong>put to a v<strong>in</strong>tage quality model for climate change impactassessment. The v<strong>in</strong>tage quality model uses a multi-regressive approach and v<strong>in</strong>tage rat<strong>in</strong>gsobta<strong>in</strong>ed from the most recently published Sotheby’s v<strong>in</strong>tage rat<strong>in</strong>gs. The rat<strong>in</strong>gs are on a scale from0 to 100, with the general categories of 0–39 disastrous, 40–59 very bad, 60–69 disappo<strong>in</strong>t<strong>in</strong>g, 70–79average to good, 80–89 good to very good, 90–100 excellent to superb.7