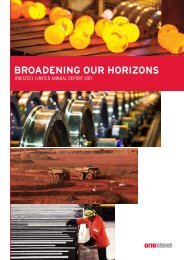
2001 Annual Report - OneSteel
2001 Annual Report - OneSteel
2001 Annual Report - OneSteel
- No tags were found...

Create successful ePaper yourself
Turn your PDF publications into a flip-book with our unique Google optimized e-Paper software.
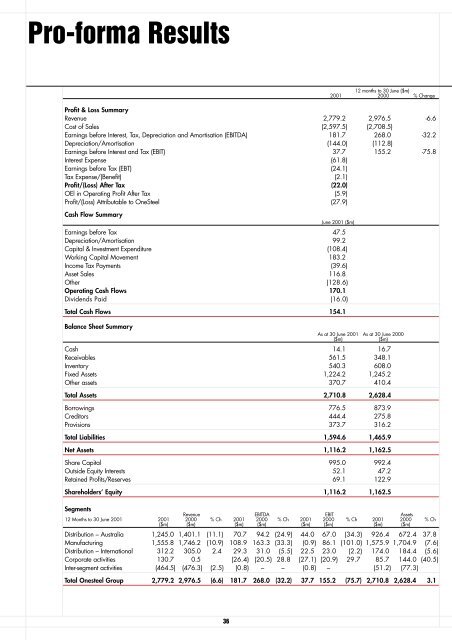
Pro-forma Results12 months to 30 June ($m)<strong>2001</strong> 2000 % ChangeProfit & Loss SummaryRevenue 2,779.2 2,976.5 -6.6Cost of Sales (2,597.5) (2,708.5)Earnings before Interest, Tax, Depreciation and Amortisation (EBITDA) 181.7 268.0 -32.2Depreciation/Amortisation (144.0) (112.8)Earnings before Interest and Tax (EBIT) 37.7 155.2 -75.8Interest Expense (61.8)Earnings before Tax (EBT) (24.1)Tax Expense/(Benefit) (2.1)Profit/(Loss) After Tax (22.0)OEl in Operating Profit After Tax (5.9)Profit/(Loss) Attributable to <strong>OneSteel</strong> (27.9)Cash Flow SummaryJune <strong>2001</strong> ($m)Earnings before Tax 47.5Depreciation/Amortisation 99.2Capital & Investment Expenditure (108.4)Working Capital Movement 183.2Income Tax Payments (39.6)Asset Sales 116.8Other (128.6)Operating Cash Flows 170.1Dividends Paid (16.0)Total Cash Flows 154.1Balance Sheet SummaryAs at 30 June <strong>2001</strong> As at 30 June 2000($m)($m)Cash 14.1 16.7Receivables 561.5 348.1Inventory 540.3 608.0Fixed Assets 1,224.2 1,245.2Other assets 370.7 410.4Total Assets 2,710.8 2,628.4Borrowings 776.5 873.9Creditors 444.4 275.8Provisions 373.7 316.2Total Liabilities 1,594.6 1,465.9Net Assets 1,116.2 1,162.5Share Capital 995.0 992.4Outside Equity Interests 52.1 47.2Retained Profits/Reserves 69.1 122.9Shareholders’ Equity 1,116.2 1,162.5SegmentsRevenue EBITDA EBIT Assets12 Months to 30 June <strong>2001</strong> <strong>2001</strong> 2000 % Ch <strong>2001</strong> 2000 % Ch <strong>2001</strong> 2000 % Ch <strong>2001</strong> 2000 % Ch($m) ($m) ($m) ($m) ($m) ($m) ($m) ($m)Distribution – Australia 1,245.0 1,401.1 (11.1) 70.7 94.2 (24.9) 44.0 67.0 (34.3) 926.4 672.4 37.8Manufacturing 1,555.8 1,746.2 (10.9) 108.9 163.3 (33.3) (0.9) 86.1 (101.0) 1,575.9 1,704.9 (7.6)Distribution – International 312.2 305.0 2.4 29.3 31.0 (5.5) 22.5 23.0 (2.2) 174.0 184.4 (5.6)Corporate activities 130.7 0.5 (26.4) (20.5) 28.8 (27.1) (20.9) 29.7 85.7 144.0 (40.5)Inter-segment activities (464.5) (476.3) (2.5) (0.8) – – (0.8) – (51.2) (77.3)Total Onesteel Group 2,779.2 2,976.5 (6.6) 181.7 268.0 (32.2) 37.7 155.2 (75.7) 2,710.8 2,628.4 3.136