2001 Annual Report - OneSteel
2001 Annual Report - OneSteel
2001 Annual Report - OneSteel
- No tags were found...

Create successful ePaper yourself
Turn your PDF publications into a flip-book with our unique Google optimized e-Paper software.
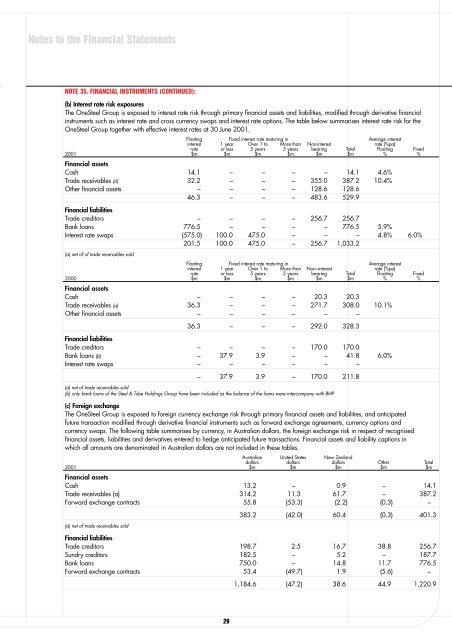
Notes to the Financial StatementsNOTE 35. FINANCIAL INSTRUMENTS (CONTINUED):(b) Interest rate risk exposuresThe <strong>OneSteel</strong> Group is exposed to interest rate risk through primary financial assets and liabilities, modified through derivative financialinstruments such as interest rate and cross currency swaps and interest rate options. The table below summarises interest rate risk for the<strong>OneSteel</strong> Group together with effective interest rates at 30 June <strong>2001</strong>.Floating Fixed interest rate maturing in Average interestinterest 1 year Over 1 to More than Non-interest rate (%pa)rate or less 5 years 5 years bearing Total Floating Fixed<strong>2001</strong> $m $m $m $m $m $m % %Financial assetsCash 14.1 – – – – 14.1 4.6%Trade receivables (a) 32.2 – – – 355.0 387.2 10.4%Other financial assets – – – – 128.6 128.646.3 – – – 483.6 529.9Financial liabilitiesTrade creditors – – – – 256.7 256.7Bank loans 776.5 – – – – 776.5 5.9%Interest rate swaps (575.0) 100.0 475.0 – – – 4.8% 6.0%201.5 100.0 475.0 – 256.7 1,033.2(a) net of of trade receivables soldFloating Fixed interest rate maturing in Average interestinterest 1 year Over 1 to More than Non–interest rate (%pa)rate or less 5 years 5 years bearing Total Floating Fixed2000 $m $m $m $m $m $m % %Financial assetsCash – – – – 20.3 20.3Trade receivables (a) 36.3 – – – 271.7 308.0 10.1%Other financial assets – – – – – –36.3 – – – 292.0 328.3Financial liabilitiesTrade creditors – – – – 170.0 170.0Bank loans (b) – 37.9 3.9 – – 41.8 6.0%Interest rate swaps – – – – – –– 37.9 3.9 – 170.0 211.8(a) net of trade receivables sold(b) only bank loans of the Steel & Tube Holdings Group have been included as the balance of the loans were intercompany with BHP(c) Foreign exchangeThe <strong>OneSteel</strong> Group is exposed to foreign currency exchange risk through primary financial assets and liabilities, and anticipatedfuture transaction modified through derivative financial instruments such as forward exchange agreements, currency options andcurrency swaps. The following table summarises by currency, in Australian dollars, the foreign exchange risk in respect of recognisedfinancial assets, liabilities and derivatives entered to hedge anticipated future transactions. Financial assets and liability captions inwhich all amounts are denominated in Australian dollars are not included in these tables.Australian United States New Zealanddollars dollars dollars Other Total<strong>2001</strong> $m $m $m $m $mFinancial assetsCash 13.2 – 0.9 – 14.1Trade receivables (a) 314.2 11.3 61.7 – 387.2Forward exchange contracts 55.8 (53.3) (2.2) (0.3) –(a) net of trade receivables sold383.2 (42.0) 60.4 (0.3) 401.3Financial liabilitiesTrade creditors 198.7 2.5 16.7 38.8 256.7Sundry creditors 182.5 – 5.2 – 187.7Bank loans 750.0 – 14.8 11.7 776.5Forward exchange contracts 53.4 (49.7) 1.9 (5.6) –1,184.6 (47.2) 38.6 44.9 1,220.929