2001 Annual Report - OneSteel
2001 Annual Report - OneSteel
2001 Annual Report - OneSteel
- No tags were found...

You also want an ePaper? Increase the reach of your titles
YUMPU automatically turns print PDFs into web optimized ePapers that Google loves.
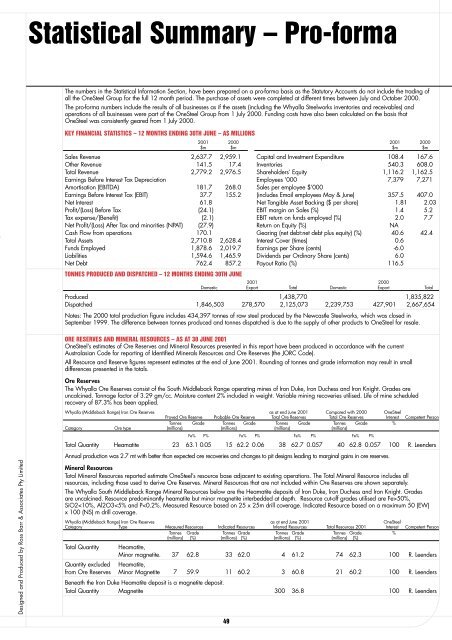
Statistical Summary – Pro-formaThe numbers in the Statistical Information Section, have been prepared on a pro-forma basis as the Statutory Accounts do not include the trading ofall the <strong>OneSteel</strong> Group for the full 12 month period. The purchase of assets were completed at different times between July and October 2000.The pro-forma numbers include the results of all businesses as if the assets (including the Whyalla Steelworks inventories and receivables) andoperations of all businesses were part of the <strong>OneSteel</strong> Group from 1 July 2000. Funding costs have also been calculated on the basis that<strong>OneSteel</strong> was consistently geared from 1 July 2000.KEY FINANCIAL STATISTICS – 12 MONTHS ENDING 30TH JUNE – A$ MILLIONS<strong>2001</strong> 2000$m $mSales Revenue 2,637.7 2,959.1Other Revenue 141.5 17.4Total Revenue 2,779.2 2,976.5Earnings Before Interest Tax DepreciationAmortisation (EBITDA) 181.7 268.0Earnings Before Interest Tax (EBIT) 37.7 155.2Net Interest 61.8Profit/(Loss) Before Tax (24.1)Tax expense/(Benefit) (2.1)Net Profit/(Loss) After Tax and minorities (NPAT) (27.9)Cash Flow from operations 170.1Total Assets 2,710.8 2,628.4Funds Employed 1,878.6 2,019.7Liabilities 1,594.6 1,465.9Net Debt 762.4 857.2TONNES PRODUCED AND DISPATCHED – 12 MONTHS ENDING 30TH JUNE<strong>2001</strong> 2000$m $mCapital and Investment Expenditure 108.4 167.6Inventories 540.3 608.0Shareholders’ Equity 1,116.2 1,162.5Employees ’000 7,379 7,271Sales per employee $’000(includes Email employees May & June) 357.5 407.0Net Tangible Asset Backing ($ per share) 1.81 2.03EBIT margin on Sales (%) 1.4 5.2EBIT return on funds employed (%) 2.0 7.7Return on Equity (%)NAGearing (net debt:net debt plus equity) (%) 40.6 42.4Interest Cover (times) 0.6Earnings per Share (cents) -6.0Dividends per Ordinary Share (cents) 6.0Payout Ratio (%) 116.5<strong>2001</strong> 2000Domestic Export Total Domestic Export TotalProduced 1,438,770 1,835,822Dispatched 1,846,503 278,570 2,125,073 2,239,753 427,901 2,667,654Notes: The 2000 total production figure includes 434,397 tonnes of raw steel produced by the Newcastle Steelworks, which was closed inSeptember 1999. The difference between tonnes produced and tonnes dispatched is due to the supply of other products to <strong>OneSteel</strong> for resale.Designed and Produced by Ross Barr & Associates Pty LimitedORE RESERVES AND MINERAL RESOURCES – AS AT 30 JUNE <strong>2001</strong><strong>OneSteel</strong>’s estimates of Ore Reserves and Mineral Resources presented in this report have been produced in accordance with the currentAustralasian Code for reporting of Identified Minerals Resources and Ore Reserves (the JORC Code).All Resource and Reserve figures represent estimates at the end of June <strong>2001</strong>. Rounding of tonnes and grade information may result in smalldifferences presented in the totals.Ore ReservesThe Whyalla Ore Reserves consist of the South Middleback Range operating mines of Iron Duke, Iron Duchess and Iron Knight. Grades areuncalcined. Tonnage factor of 3.29 gm/cc. Moisture content 2% included in weight. Variable mining recoveries utilised. Life of mine scheduledrecovery of 87.3% has been applied.Whyalla (Middleback Range) Iron Ore Reserves as at end June <strong>2001</strong> Compared with 2000 <strong>OneSteel</strong>Proved Ore Reserve Probable Ore Reserve Total Ore Reserves Total Ore Reserves Interest Competent PersonTonnes Grade Tonnes Grade Tonnes Grade Tonnes Grade %Category Ore type (millions) (millions) (millions) (millions)Fe% P% Fe% P% Fe% P% Fe% P%Total Quantity Heamatite 23 63.1 0.05 15 62.2 0.06 38 62.7 0.057 40 62.8 0.057 100 R. Leenders<strong>Annual</strong> production was 2.7 mt with better than expected ore recoveries and changes to pit designs leading to marginal gains in ore reserves.Mineral ResourcesTotal Mineral Resources reported estimate <strong>OneSteel</strong>’s resource base adjacent to existing operations. The Total Mineral Resource includes allresources, including those used to derive Ore Reserves. Mineral Resources that are not included within Ore Reserves are shown separately.The Whyalla South Middleback Range Mineral Resources below are the Heamatite deposits of Iron Duke, Iron Duchess and Iron Knight. Gradesare uncalcined. Resource predominantly heamatite but minor magnetite interbedded at depth. Resource cut-off grades utilised are Fe>50%,SiO2