

Untitled - Technische Universiteit Eindhoven
Untitled - Technische Universiteit Eindhoven
Untitled - Technische Universiteit Eindhoven
- No tags were found...

You also want an ePaper? Increase the reach of your titles
YUMPU automatically turns print PDFs into web optimized ePapers that Google loves.
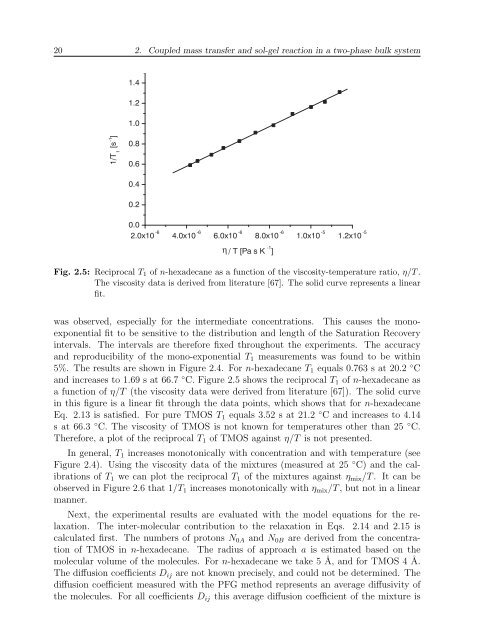
20 2. Coupled mass transfer and sol-gel reaction in a two-phase bulk system1.41.21.01/T 1[s -1 ]0.80.60.40.20.02.0x10 -6 4.0x10 -6 6.0x10 -6 8.0x10 -6 1.0x10 -5 1.2x10 -5η / T [Pa s K -1 ]Fig. 2.5: Reciprocal T 1 of n-hexadecane as a function of the viscosity-temperature ratio, η/T .The viscosity data is derived from literature [67]. The solid curve represents a linearfit.was observed, especially for the intermediate concentrations. This causes the monoexponentialfit to be sensitive to the distribution and length of the Saturation Recoveryintervals. The intervals are therefore fixed throughout the experiments. The accuracyand reproducibility of the mono-exponential T 1 measurements was found to be within5%. The results are shown in Figure 2.4. For n-hexadecane T 1 equals 0.763 s at 20.2 ◦ Cand increases to 1.69 s at 66.7 ◦ C. Figure 2.5 shows the reciprocal T 1 of n-hexadecane asa function of η/T (the viscosity data were derived from literature [67]). The solid curvein this figure is a linear fit through the data points, which shows that for n-hexadecaneEq. 2.13 is satisfied. For pure TMOS T 1 equals 3.52 s at 21.2 ◦ C and increases to 4.14s at 66.3 ◦ C. The viscosity of TMOS is not known for temperatures other than 25 ◦ C.Therefore, a plot of the reciprocal T 1 of TMOS against η/T is not presented.In general, T 1 increases monotonically with concentration and with temperature (seeFigure 2.4). Using the viscosity data of the mixtures (measured at 25 ◦ C) and the calibrationsof T 1 we can plot the reciprocal T 1 of the mixtures against η mix /T . It can beobserved in Figure 2.6 that 1/T 1 increases monotonically with η mix /T , but not in a linearmanner.Next, the experimental results are evaluated with the model equations for the relaxation.The inter-molecular contribution to the relaxation in Eqs. 2.14 and 2.15 iscalculated first. The numbers of protons N 0A and N 0B are derived from the concentrationof TMOS in n-hexadecane. The radius of approach a is estimated based on themolecular volume of the molecules. For n-hexadecane we take 5 Å, and for TMOS 4 Å.The diffusion coefficients D ij are not known precisely, and could not be determined. Thediffusion coefficient measured with the PFG method represents an average diffusivity ofthe molecules. For all coefficients D ij this average diffusion coefficient of the mixture is


