

Untitled - Technische Universiteit Eindhoven
Untitled - Technische Universiteit Eindhoven
Untitled - Technische Universiteit Eindhoven
- No tags were found...

You also want an ePaper? Increase the reach of your titles
YUMPU automatically turns print PDFs into web optimized ePapers that Google loves.
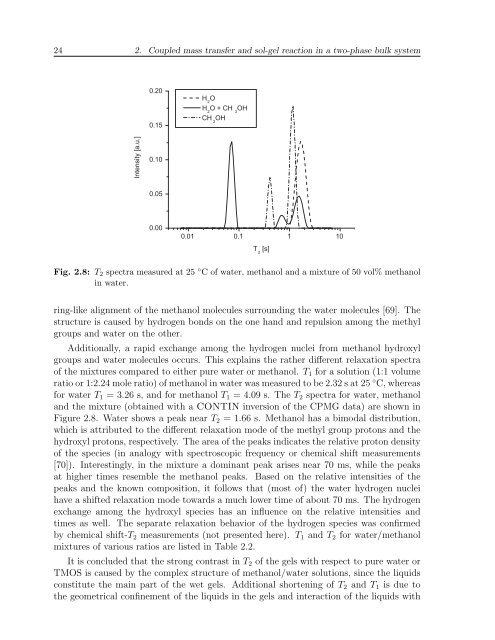
24 2. Coupled mass transfer and sol-gel reaction in a two-phase bulk system # 0 0 + 0! 0 + 0! 01 J A I E J O = K # 6 I Fig. 2.8: T 2 spectra measured at 25 ◦ C of water, methanol and a mixture of 50 vol% methanolin water.ring-like alignment of the methanol molecules surrounding the water molecules [69]. Thestructure is caused by hydrogen bonds on the one hand and repulsion among the methylgroups and water on the other.Additionally, a rapid exchange among the hydrogen nuclei from methanol hydroxylgroups and water molecules occurs. This explains the rather different relaxation spectraof the mixtures compared to either pure water or methanol. T 1 for a solution (1:1 volumeratio or 1:2.24 mole ratio) of methanol in water was measured to be 2.32 s at 25 ◦ C, whereasfor water T 1 = 3.26 s, and for methanol T 1 = 4.09 s. The T 2 spectra for water, methanoland the mixture (obtained with a CONTIN inversion of the CPMG data) are shown inFigure 2.8. Water shows a peak near T 2 = 1.66 s. Methanol has a bimodal distribution,which is attributed to the different relaxation mode of the methyl group protons and thehydroxyl protons, respectively. The area of the peaks indicates the relative proton densityof the species (in analogy with spectroscopic frequency or chemical shift measurements[70]). Interestingly, in the mixture a dominant peak arises near 70 ms, while the peaksat higher times resemble the methanol peaks. Based on the relative intensities of thepeaks and the known composition, it follows that (most of) the water hydrogen nucleihave a shifted relaxation mode towards a much lower time of about 70 ms. The hydrogenexchange among the hydroxyl species has an influence on the relative intensities andtimes as well. The separate relaxation behavior of the hydrogen species was confirmedby chemical shift-T 2 measurements (not presented here). T 1 and T 2 for water/methanolmixtures of various ratios are listed in Table 2.2.It is concluded that the strong contrast in T 2 of the gels with respect to pure water orTMOS is caused by the complex structure of methanol/water solutions, since the liquidsconstitute the main part of the wet gels. Additional shortening of T 2 and T 1 is due tothe geometrical confinement of the liquids in the gels and interaction of the liquids with


