

Untitled - Technische Universiteit Eindhoven
Untitled - Technische Universiteit Eindhoven
Untitled - Technische Universiteit Eindhoven
- No tags were found...

You also want an ePaper? Increase the reach of your titles
YUMPU automatically turns print PDFs into web optimized ePapers that Google loves.
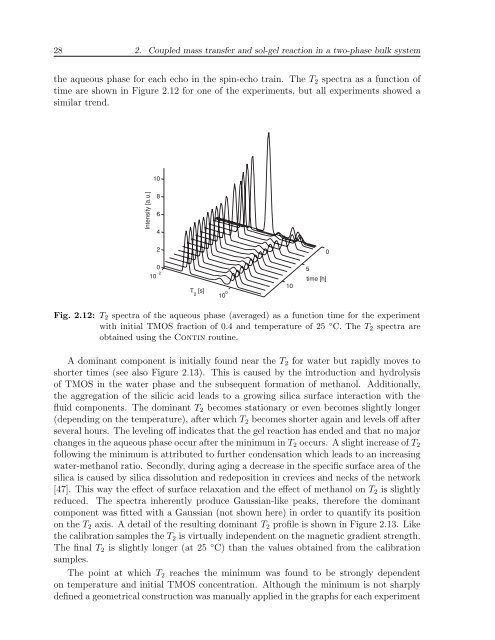
28 2. Coupled mass transfer and sol-gel reaction in a two-phase bulk systemthe aqueous phase for each echo in the spin-echo train. The T 2 spectra as a function oftime are shown in Figure 2.12 for one of the experiments, but all experiments showed asimilar trend.10Intensity [a.u.]8642010 -2 T 2[s]10 0105time [h]0Fig. 2.12: T 2 spectra of the aqueous phase (averaged) as a function time for the experimentwith initial TMOS fraction of 0.4 and temperature of 25 ◦ C. The T 2 spectra areobtained using the Contin routine.A dominant component is initially found near the T 2 for water but rapidly moves toshorter times (see also Figure 2.13). This is caused by the introduction and hydrolysisof TMOS in the water phase and the subsequent formation of methanol. Additionally,the aggregation of the silicic acid leads to a growing silica surface interaction with thefluid components. The dominant T 2 becomes stationary or even becomes slightly longer(depending on the temperature), after which T 2 becomes shorter again and levels off afterseveral hours. The leveling off indicates that the gel reaction has ended and that no majorchanges in the aqueous phase occur after the minimum in T 2 occurs. A slight increase of T 2following the minimum is attributed to further condensation which leads to an increasingwater-methanol ratio. Secondly, during aging a decrease in the specific surface area of thesilica is caused by silica dissolution and redeposition in crevices and necks of the network[47]. This way the effect of surface relaxation and the effect of methanol on T 2 is slightlyreduced. The spectra inherently produce Gaussian-like peaks, therefore the dominantcomponent was fitted with a Gaussian (not shown here) in order to quantify its positionon the T 2 axis. A detail of the resulting dominant T 2 profile is shown in Figure 2.13. Likethe calibration samples the T 2 is virtually independent on the magnetic gradient strength.The final T 2 is slightly longer (at 25 ◦ C) than the values obtained from the calibrationsamples.The point at which T 2 reaches the minimum was found to be strongly dependenton temperature and initial TMOS concentration. Although the minimum is not sharplydefined a geometrical construction was manually applied in the graphs for each experiment


