

Untitled - Technische Universiteit Eindhoven
Untitled - Technische Universiteit Eindhoven
Untitled - Technische Universiteit Eindhoven
- No tags were found...

You also want an ePaper? Increase the reach of your titles
YUMPU automatically turns print PDFs into web optimized ePapers that Google loves.
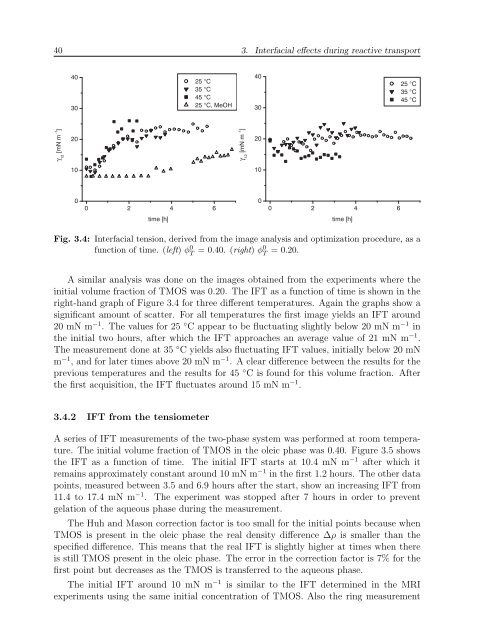
40 3. Interfacial effects during reactive transport403025 °C35 °C45 °C25 °C, MeOH403025 °C35 °C45 °C12 [mN m -1 ]γ2012 [mN m -1 ]2010γ1000 2 4 600 2 4 6time [h]time [h]Fig. 3.4: Interfacial tension, derived from the image analysis and optimization procedure, as afunction of time. (left) φ 0 T = 0.40. (right) φ0 T = 0.20.A similar analysis was done on the images obtained from the experiments where theinitial volume fraction of TMOS was 0.20. The IFT as a function of time is shown in theright-hand graph of Figure 3.4 for three different temperatures. Again the graphs show asignificant amount of scatter. For all temperatures the first image yields an IFT around20 mN m −1 . The values for 25 ◦ C appear to be fluctuating slightly below 20 mN m −1 inthe initial two hours, after which the IFT approaches an average value of 21 mN m −1 .The measurement done at 35 ◦ C yields also fluctuating IFT values, initially below 20 mNm −1 , and for later times above 20 mN m −1 . A clear difference between the results for theprevious temperatures and the results for 45 ◦ C is found for this volume fraction. Afterthe first acquisition, the IFT fluctuates around 15 mN m −1 .3.4.2 IFT from the tensiometerA series of IFT measurements of the two-phase system was performed at room temperature.The initial volume fraction of TMOS in the oleic phase was 0.40. Figure 3.5 showsthe IFT as a function of time. The initial IFT starts at 10.4 mN m −1 after which itremains approximately constant around 10 mN m −1 in the first 1.2 hours. The other datapoints, measured between 3.5 and 6.9 hours after the start, show an increasing IFT from11.4 to 17.4 mN m −1 . The experiment was stopped after 7 hours in order to preventgelation of the aqueous phase during the measurement.The Huh and Mason correction factor is too small for the initial points because whenTMOS is present in the oleic phase the real density difference ∆ρ is smaller than thespecified difference. This means that the real IFT is slightly higher at times when thereis still TMOS present in the oleic phase. The error in the correction factor is 7% for thefirst point but decreases as the TMOS is transferred to the aqueous phase.The initial IFT around 10 mN m −1 is similar to the IFT determined in the MRIexperiments using the same initial concentration of TMOS. Also the ring measurement


