Deepening Integration in SADC - Fes-botswana.org
Deepening Integration in SADC - Fes-botswana.org
Deepening Integration in SADC - Fes-botswana.org

Create successful ePaper yourself
Turn your PDF publications into a flip-book with our unique Google optimized e-Paper software.
3. To ensure equitable and susta<strong>in</strong>able use of environment and natural<br />
resources for the benefit of present and future generations.<br />
These three goals constitute one agenda for action. None is achievable<br />
without the other and they are not also achievable without significant<br />
changes <strong>in</strong> <strong>in</strong>ternational trade and macroeconomic policies. Without<br />
more equitable <strong>in</strong>ternational economic arrangements, most develop<strong>in</strong>g<br />
countries <strong>in</strong> and outside the <strong>SADC</strong> region have limited scope and little<br />
hope for achiev<strong>in</strong>g economic, social and environmental susta<strong>in</strong>ability.<br />
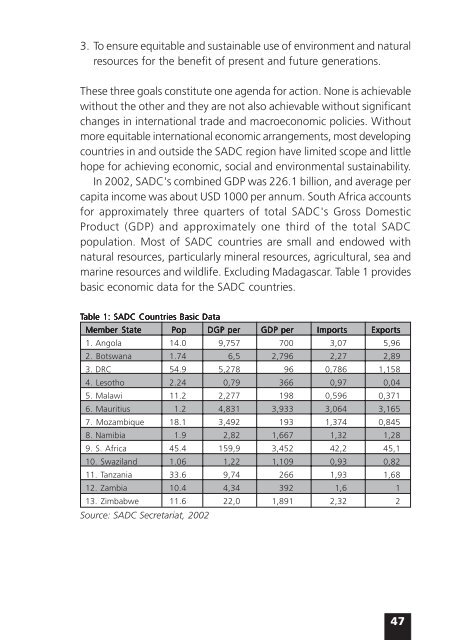
In 2002, <strong>SADC</strong>'s comb<strong>in</strong>ed GDP was 226.1 billion, and average per<br />
capita <strong>in</strong>come was about USD 1000 per annum. South Africa accounts<br />
for approximately three quarters of total <strong>SADC</strong>'s Gross Domestic<br />
Product (GDP) and approximately one third of the total <strong>SADC</strong><br />
population. Most of <strong>SADC</strong> countries are small and endowed with<br />
natural resources, particularly m<strong>in</strong>eral resources, agricultural, sea and<br />
mar<strong>in</strong>e resources and wildlife. Exclud<strong>in</strong>g Madagascar. Table 1 provides<br />
basic economic data for the <strong>SADC</strong> countries.<br />
Table able 1: 1: <strong>SADC</strong> <strong>SADC</strong> Countries Countries Basic Basic Data<br />
Data<br />
Member Member State State Pop Pop DGP DGP DGP per per GDP GDP per per per Imports Imports Exports<br />
Exports<br />
1. Angola 14.0 9,757 700 3,07 5,96<br />
2. Botswana 1.74 6,5 2,796 2,27 2,89<br />
3. DRC 54.9 5,278 96 0,786 1,158<br />
4. Lesotho 2.24 0,79 366 0,97 0,04<br />
5. Malawi 11.2 2,277 198 0,596 0,371<br />
6. Mauritius 1.2 4,831 3,933 3,064 3,165<br />
7. Mozambique 18.1 3,492 193 1,374 0,845<br />
8. Namibia 1.9 2,82 1,667 1,32 1,28<br />
9. S. Africa 45.4 159,9 3,452 42,2 45,1<br />
10. Swaziland 1.06 1,22 1,109 0,93 0,82<br />
11. Tanzania 33.6 9,74 266 1,93 1,68<br />
12. Zambia 10.4 4,34 392 1,6 1<br />
13. Zimbabwe 11.6 22,0 1,891 2,32 2<br />
Source: <strong>SADC</strong> Secretariat, 2002<br />
47