cont'd - KNM Steel Sdn Bhd
cont'd - KNM Steel Sdn Bhd
cont'd - KNM Steel Sdn Bhd
- No tags were found...

You also want an ePaper? Increase the reach of your titles
YUMPU automatically turns print PDFs into web optimized ePapers that Google loves.
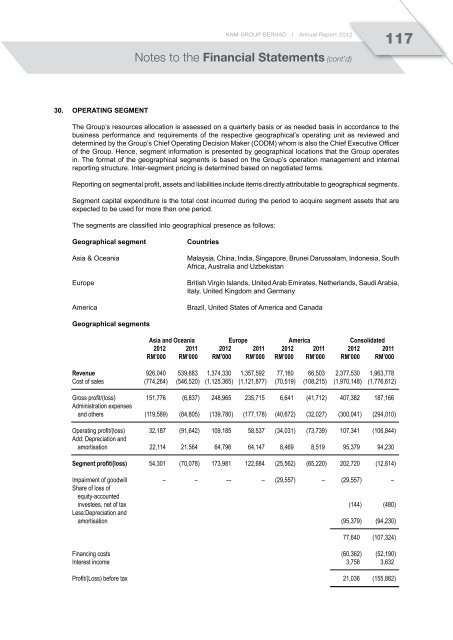
<strong>KNM</strong> GROUP BERHAD I Annual Report 2012117Notes to the Financial Statements (cont’d)30. Operating segmentThe Group’s resources allocation is assessed on a quarterly basis or as needed basis in accordance to thebusiness performance and requirements of the respective geographical’s operating unit as reviewed anddetermined by the Group’s Chief Operating Decision Maker (CODM) whom is also the Chief Executive Officerof the Group. Hence, segment information is presented by geographical locations that the Group operatesin. The format of the geographical segments is based on the Group’s operation management and internalreporting structure. Inter-segment pricing is determined based on negotiated terms.Reporting on segmental profit, assets and liabilities include items directly attributable to geographical segments.Segment capital expenditure is the total cost incurred during the period to acquire segment assets that areexpected to be used for more than one period.The segments are classified into geographical presence as follows:Geographical segmentAsia & OceaniaEuropeAmericaCountriesMalaysia, China, India, Singapore, Brunei Darussalam, Indonesia, SouthAfrica, Australia and UzbekistanBritish Virgin Islands, United Arab Emirates, Netherlands, Saudi Arabia,Italy, United Kingdom and GermanyBrazil, United States of America and CanadaGeographical segmentsAsia and Oceania Europe America Consolidated2012 2011 2012 2011 2012 2011 2012 2011RM’000 RM’000 RM’000 RM’000 RM’000 RM’000 RM’000 RM’000Revenue 926,040 539,683 1,374,330 1,357,592 77,160 66,503 2,377,530 1,963,778Cost of sales (774,264) (546,520) (1,125,365) (1,121,877) (70,519) (108,215) (1,970,148) (1,776,612)Gross profit/(loss) 151,776 (6,837) 248,965 235,715 6,641 (41,712) 407,382 187,166Administration expensesand others (119,589) (84,805) (139,780) (177,178) (40,672) (32,027) (300,041) (294,010)Operating profit/(loss) 32,187 (91,642) 109,185 58,537 (34,031) (73,739) 107,341 (106,844)Add: Depreciation andamortisation 22,114 21,564 64,796 64,147 8,469 8,519 95,379 94,230Segment profit/(loss) 54,301 (70,078) 173,981 122,684 (25,562) (65,220) 202,720 (12,614)Impairment of goodwill – – –- – (29,557) – (29,557) –Share of loss ofequity-accountedinvestees, net of tax (144) (480)Less:Depreciation andamortisation (95,379) (94,230)77,640 (107,324)Financing costs (60,362) (52,190)Interest income 3,758 3,632Profit/(Loss) before tax 21,036 (155,882)