cont'd - KNM Steel Sdn Bhd
cont'd - KNM Steel Sdn Bhd
cont'd - KNM Steel Sdn Bhd
- No tags were found...

You also want an ePaper? Increase the reach of your titles
YUMPU automatically turns print PDFs into web optimized ePapers that Google loves.
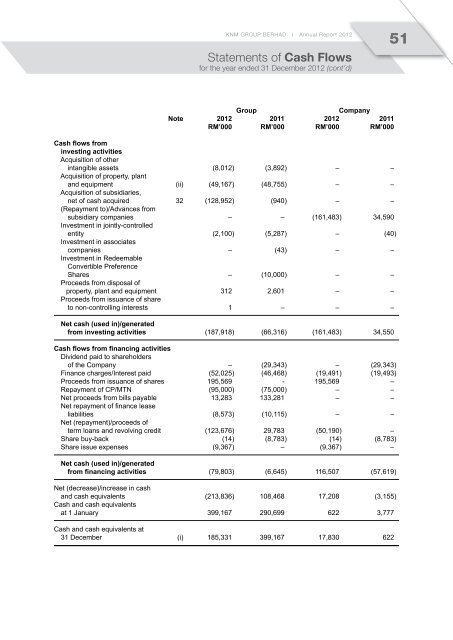
<strong>KNM</strong> GROUP BERHAD I Annual Report 2012Statements of Cash Flowsfor the year ended 31 December 2012 (cont’d)51GroupCompanyNote 2012 2011 2012 2011RM’000 RM’000 RM’000 RM’000Cash flows frominvesting activitiesAcquisition of otherintangible assets (8,012) (3,892) – –Acquisition of property, plantand equipment (ii) (49,167) (48,755) – –Acquisition of subsidiaries,net of cash acquired 32 (128,952) (940) – –(Repayment to)/Advances fromsubsidiary companies – – (161,483) 34,590Investment in jointly-controlledentity (2,100) (5,287) – (40)Investment in associatescompanies – (43) – –Investment in RedeemableConvertible PreferenceShares – (10,000) – –Proceeds from disposal ofproperty, plant and equipment 312 2,601 – –Proceeds from issuance of shareto non-controlling interests 1 – – –Net cash (used in)/generatedfrom investing activities (187,918) (66,316) (161,483) 34,550Cash flows from financing activitiesDividend paid to shareholdersof the Company – (29,343) – (29,343)Finance charges/Interest paid (52,025) (46,468) (19,491) (19,493)Proceeds from issuance of shares 195,569 - 195,569 –Repayment of CP/MTN (95,000) (75,000) – –Net proceeds from bills payable 13,283 133,281 – –Net repayment of finance leaseliabilities (8,573) (10,115) – –Net (repayment)/proceeds ofterm loans and revolving credit (123,676) 29,783 (50,190) –Share buy-back (14) (8,783) (14) (8,783)Share issue expenses (9,367) – (9,367) –Net cash (used in)/generatedfrom financing activities (79,803) (6,645) 116,507 (57,619)Net (decrease)/increase in cashand cash equivalents (213,836) 108,468 17,208 (3,155)Cash and cash equivalentsat 1 January 399,167 290,699 622 3,777Cash and cash equivalents at31 December (i) 185,331 399,167 17,830 622