cont'd - KNM Steel Sdn Bhd
cont'd - KNM Steel Sdn Bhd
cont'd - KNM Steel Sdn Bhd
- No tags were found...

Create successful ePaper yourself
Turn your PDF publications into a flip-book with our unique Google optimized e-Paper software.
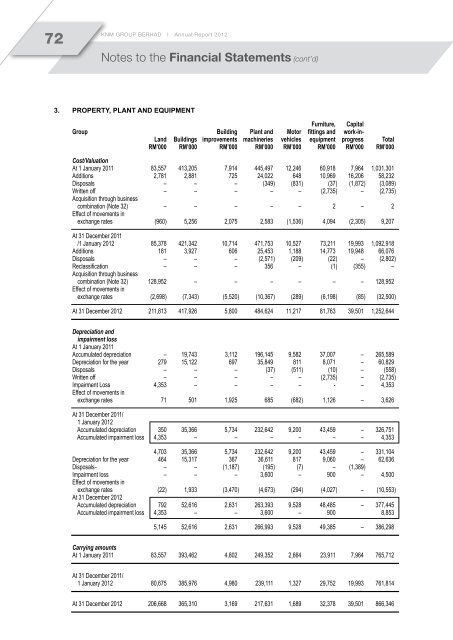
72<strong>KNM</strong> GROUP BERHAD I Annual Report 2012Notes to the Financial Statements (cont’d)3. Property, plant and equipmentFurniture, CapitalGroup Building Plant and Motor fittings and work-in-Land Buildings improvements machineries vehicles equipment progress TotalRM’000 RM’000 RM’000 RM’000 RM’000 RM’000 RM’000 RM’000Cost/ValuationAt 1 January 2011 83,557 413,205 7,914 445,497 12,246 60,918 7,964 1,031,301Additions 2,781 2,881 725 24,022 648 10,969 16,206 58,232Disposals – – – (349) (831) (37) (1,872) (3,089)Written off – – – – – (2,735) – (2,735)Acquisition through businesscombination (Note 32) – – – – – 2 – 2Effect of movements inexchange rates (960) 5,256 2,075 2,583 (1,536) 4,094 (2,305) 9,207At 31 December 2011/1 January 2012 85,378 421,342 10,714 471,753 10,527 73,211 19,993 1,092,918Additions 181 3,927 606 25,453 1,188 14,773 19,948 66,076Disposals – – – (2,571) (209) (22) – (2,802)Reclassification – – – 356 – (1) (355) –Acquisition through businesscombination (Note 32) 128,952 – – – – – – 128,952Effect of movements inexchange rates (2,698) (7,343) (5,520) (10,367) (289) (6,198) (85) (32,500)At 31 December 2012 211,813 417,926 5,800 484,624 11,217 81,763 39,501 1,252,644Depreciation andimpairment lossAt 1 January 2011Accumulated depreciation – 19,743 3,112 196,145 9,582 37,007 – 265,589Depreciation for the year 279 15,122 697 35,849 811 8,071 – 60,829Disposals – – – (37) (511) (10) – (558)Written off – – – – – (2,735) – (2,735)Impairment Loss 4,353 – – – – - – 4,353Effect of movements inexchange rates 71 501 1,925 685 (682) 1,126 – 3,626At 31 December 2011/1 January 2012Accumulated depreciation 350 35,366 5,734 232,642 9,200 43,459 – 326,751Accumulated impairment loss 4,353 – – – – – – 4,3534,703 35,366 5,734 232,642 9,200 43,459 – 331,104Depreciation for the year 464 15,317 367 36,611 817 9,060 – 62,636Disposals - – – (1,187) (195) (7) – (1,389)Impairment loss – – – 3,600 – 900 – 4,500Effect of movements inexchange rates (22) 1,933 (3,470) (4,673) (294) (4,027) – (10,553)At 31 December 2012Accumulated depreciation 792 52,616 2,631 263,393 9,528 48,485 – 377,445Accumulated impairment loss 4,353 – – 3,600 – 900 8,8535,145 52,616 2,631 266,993 9,528 49,385 – 386,298Carrying amountsAt 1 January 2011 83,557 393,462 4,802 249,352 2,664 23,911 7,964 765,712At 31 December 2011/1 January 2012 80,675 385,976 4,980 239,111 1,327 29,752 19,993 761,814At 31 December 2012 206,668 365,310 3,169 217,631 1,689 32,378 39,501 866,346