Sepulveda Dam Basin Master Plan - Los Angeles District - U.S. Army
Sepulveda Dam Basin Master Plan - Los Angeles District - U.S. Army
Sepulveda Dam Basin Master Plan - Los Angeles District - U.S. Army
- No tags were found...

Create successful ePaper yourself
Turn your PDF publications into a flip-book with our unique Google optimized e-Paper software.
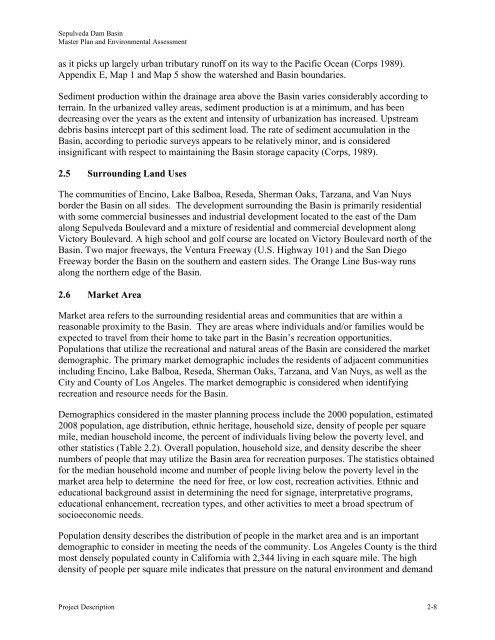
<strong>Sepulveda</strong> <strong>Dam</strong> <strong>Basin</strong><strong>Master</strong> <strong>Plan</strong> and Environmental Assessmentas it picks up largely urban tributary runoff on its way to the Pacific Ocean (Corps 1989).Appendix E, Map 1 and Map 5 show the watershed and <strong>Basin</strong> boundaries.Sediment production within the drainage area above the <strong>Basin</strong> varies considerably according toterrain. In the urbanized valley areas, sediment production is at a minimum, and has beendecreasing over the years as the extent and intensity of urbanization has increased. Upstreamdebris basins intercept part of this sediment load. The rate of sediment accumulation in the<strong>Basin</strong>, according to periodic surveys appears to be relatively minor, and is consideredinsignificant with respect to maintaining the <strong>Basin</strong> storage capacity (Corps, 1989).2.5 Surrounding Land UsesThe communities of Encino, Lake Balboa, Reseda, Sherman Oaks, Tarzana, and Van Nuysborder the <strong>Basin</strong> on all sides. The development surrounding the <strong>Basin</strong> is primarily residentialwith some commercial businesses and industrial development located to the east of the <strong>Dam</strong>along <strong>Sepulveda</strong> Boulevard and a mixture of residential and commercial development alongVictory Boulevard. A high school and golf course are located on Victory Boulevard north of the<strong>Basin</strong>. Two major freeways, the Ventura Freeway (U.S. Highway 101) and the San DiegoFreeway border the <strong>Basin</strong> on the southern and eastern sides. The Orange Line Bus-way runsalong the northern edge of the <strong>Basin</strong>.2.6 Market AreaMarket area refers to the surrounding residential areas and communities that are within areasonable proximity to the <strong>Basin</strong>. They are areas where individuals and/or families would beexpected to travel from their home to take part in the <strong>Basin</strong>’s recreation opportunities.Populations that utilize the recreational and natural areas of the <strong>Basin</strong> are considered the marketdemographic. The primary market demographic includes the residents of adjacent communitiesincluding Encino, Lake Balboa, Reseda, Sherman Oaks, Tarzana, and Van Nuys, as well as theCity and County of <strong>Los</strong> <strong>Angeles</strong>. The market demographic is considered when identifyingrecreation and resource needs for the <strong>Basin</strong>.Demographics considered in the master planning process include the 2000 population, estimated2008 population, age distribution, ethnic heritage, household size, density of people per squaremile, median household income, the percent of individuals living below the poverty level, andother statistics (Table 2.2). Overall population, household size, and density describe the sheernumbers of people that may utilize the <strong>Basin</strong> area for recreation purposes. The statistics obtainedfor the median household income and number of people living below the poverty level in themarket area help to determine the need for free, or low cost, recreation activities. Ethnic andeducational background assist in determining the need for signage, interpretative programs,educational enhancement, recreation types, and other activities to meet a broad spectrum ofsocioeconomic needs.Population density describes the distribution of people in the market area and is an importantdemographic to consider in meeting the needs of the community. <strong>Los</strong> <strong>Angeles</strong> County is the thirdmost densely populated county in California with 2,344 living in each square mile. The highdensity of people per square mile indicates that pressure on the natural environment and demandProject Description 2-8