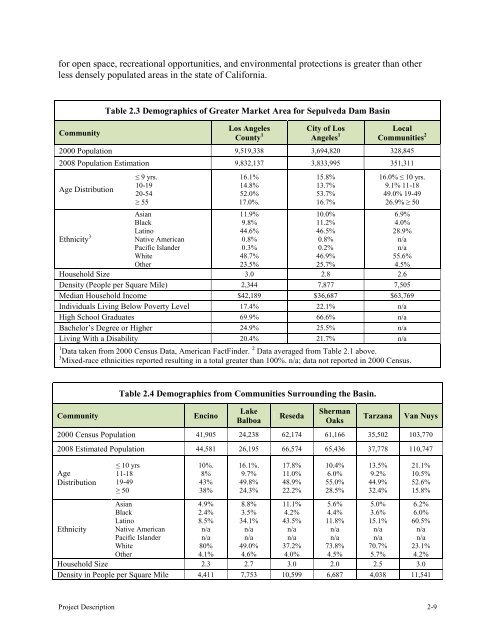
<strong>Sepulveda</strong> <strong>Dam</strong> <strong>Basin</strong><strong>Master</strong> <strong>Plan</strong> and Environmental Assessmentas it picks up largely urban tributary runoff on its way to the Pacific Ocean (Corps 1989).Appendix E, Map 1 and Map 5 show the watershed and <strong>Basin</strong> boundaries.Sediment production within the drainage area above the <strong>Basin</strong> varies considerably according toterrain. In the urbanized valley areas, sediment production is at a minimum, and has beendecreasing over the years as the extent and intensity of urbanization has increased. Upstreamdebris basins intercept part of this sediment load. The rate of sediment accumulation in the<strong>Basin</strong>, according to periodic surveys appears to be relatively minor, and is consideredinsignificant with respect to maintaining the <strong>Basin</strong> storage capacity (Corps, 1989).2.5 Surrounding Land UsesThe communities of Encino, Lake Balboa, Reseda, Sherman Oaks, Tarzana, and Van Nuysborder the <strong>Basin</strong> on all sides. The development surrounding the <strong>Basin</strong> is primarily residentialwith some commercial businesses and industrial development located to the east of the <strong>Dam</strong>along <strong>Sepulveda</strong> Boulevard and a mixture of residential and commercial development alongVictory Boulevard. A high school and golf course are located on Victory Boulevard north of the<strong>Basin</strong>. Two major freeways, the Ventura Freeway (U.S. Highway 101) and the San DiegoFreeway border the <strong>Basin</strong> on the southern and eastern sides. The Orange Line Bus-way runsalong the northern edge of the <strong>Basin</strong>.2.6 Market AreaMarket area refers to the surrounding residential areas and communities that are within areasonable proximity to the <strong>Basin</strong>. They are areas where individuals and/or families would beexpected to travel from their home to take part in the <strong>Basin</strong>’s recreation opportunities.Populations that utilize the recreational and natural areas of the <strong>Basin</strong> are considered the marketdemographic. The primary market demographic includes the residents of adjacent communitiesincluding Encino, Lake Balboa, Reseda, Sherman Oaks, Tarzana, and Van Nuys, as well as theCity and County of <strong>Los</strong> <strong>Angeles</strong>. The market demographic is considered when identifyingrecreation and resource needs for the <strong>Basin</strong>.Demographics considered in the master planning process include the 2000 population, estimated2008 population, age distribution, ethnic heritage, household size, density of people per squaremile, median household income, the percent of individuals living below the poverty level, andother statistics (Table 2.2). Overall population, household size, and density describe the sheernumbers of people that may utilize the <strong>Basin</strong> area for recreation purposes. The statistics obtainedfor the median household income and number of people living below the poverty level in themarket area help to determine the need for free, or low cost, recreation activities. Ethnic andeducational background assist in determining the need for signage, interpretative programs,educational enhancement, recreation types, and other activities to meet a broad spectrum ofsocioeconomic needs.Population density describes the distribution of people in the market area and is an importantdemographic to consider in meeting the needs of the community. <strong>Los</strong> <strong>Angeles</strong> County is the thirdmost densely populated county in California with 2,344 living in each square mile. The highdensity of people per square mile indicates that pressure on the natural environment and demandProject Description 2-8
for open space, recreational opportunities, and environmental protections is greater than otherless densely populated areas in the state of California.CommunityTable 2.3 Demographics of Greater Market Area for <strong>Sepulveda</strong> <strong>Dam</strong> <strong>Basin</strong><strong>Los</strong> <strong>Angeles</strong>County 1City of <strong>Los</strong><strong>Angeles</strong> 1LocalCommunities 22000 Population 9,519,338 3,694,820 328,8452008 Population Estimation 9,832,137 3,833,995 351,311Age DistributionEthnicity 3≤ 9 yrs.10-1920-54≥ 55AsianBlackLatinoNative AmericanPacific IslanderWhiteOther16.1%14.8%52.0%17.0%.11.9%9.8%44.6%0.8%0.3%48.7%23.5%15.8%13.7%53.7%16.7%10.0%11.2%46.5%0.8%0.2%46.9%25.7%16.0% ≤ 10 yrs.9.1% 11-1849.0% 19-4926.9% ≥ 506.9%4.0%28.9%n/an/a55.6%4.5%Household Size 3.0 2.8 2.6Density (People per Square Mile) 2,344 7,877 7,505Median Household Income $42,189 $36,687 $63,769Individuals Living Below Poverty Level 17.4% 22.1% n/aHigh School Graduates 69.9% 66.6% n/aBachelor’s Degree or Higher 24.9% 25.5% n/aLiving With a Disability 20.4% 21.7% n/a1 Data taken from 2000 Census Data, American FactFinder. 2 Data averaged from Table 2.1 above.3 Mixed-race ethnicities reported resulting in a total greater than 100%. n/a; data not reported in 2000 Census.CommunityTable 2.4 Demographics from Communities Surrounding the <strong>Basin</strong>.EncinoLakeBalboaResedaShermanOaksTarzanaVan Nuys2000 Census Population 41,905 24,238 62,174 61,166 35,502 103,7702008 Estimated Population 44,581 26,195 66,574 65,436 37,778 110,747AgeDistributionEthnicity≤ 10 yrs11-1819-49≥ 50AsianBlackLatinoNative AmericanPacific IslanderWhiteOther10%.8%43%38%4.9%2.4%8.5%n/an/a80%4.1%16.1%.9.7%49.8%24.3%8.8%3.5%34.1%n/an/a49.0%4.6%17.8%11.0%48.9%22.2%11.1%4.2%43.5%n/an/a37.2%4.0%10.4%6.0%55.0%28.5%5.6%4.4%11.8%n/an/a73.8%4.5%13.5%9.2%44.9%32.4%5.0%3.6%15.1%n/an/a70.7%5.7%21.1%10.5%52.6%15.8%6.2%6.0%60.5%n/an/a23.1%4.2%Household Size 2.3 2.7 3.0 2.0 2.5 3.0Density in People per Square Mile 4,411 7,753 10,599 6,687 4,038 11,541Project Description 2-9