Final Program EXPRES 2012 - Conferences
Final Program EXPRES 2012 - Conferences
Final Program EXPRES 2012 - Conferences
- No tags were found...

You also want an ePaper? Increase the reach of your titles
YUMPU automatically turns print PDFs into web optimized ePapers that Google loves.
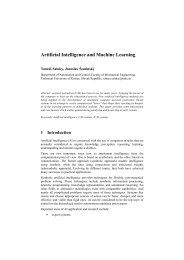
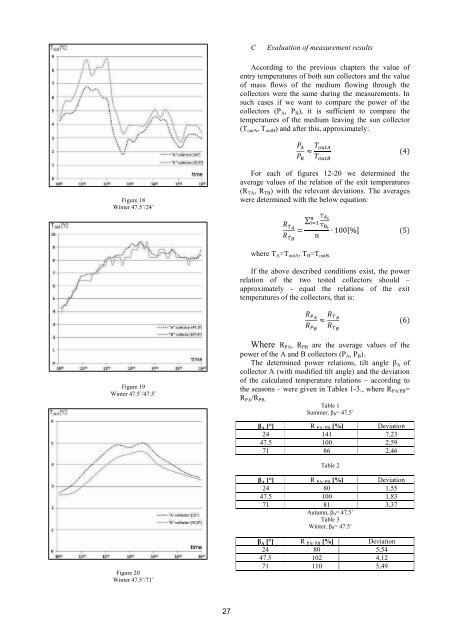
CEvaluation of measurement resultsAccording to the previous chapters the value ofentry temperatures of both sun collectors and the valueof mass flows of the medium flowing through thecollectors were the same during the measurements. Insuch cases if we want to compare the power of thecollectors (P A , P B ), it is sufficient to compare thetemperatures of the medium leaving the sun collector(T outA , T outB ) and after this, approximately:( )Figure 18Winter 47.5˚/24˚For each of figures 12-20 we determined theaverage values of the relation of the exit temperatures(R TA , R TB ) with the relevant deviations. The averageswere determined with the below equation:∑[ ] ( )where T A =T outA , T B =T outB.If the above described conditions exist, the powerrelation of the two tested collectors should –approximately - equal the relations of the exittemperatures of the collectors, that is:( )Figure 19Winter 47.5˚/47.5˚Where R PA , R PB are the average values of thepower of the A and B collectors (P A , P B ).The determined power relations, tilt angle β A ofcollector A (with modified tilt angle) and the deviationof the calculated temperature relations – according tothe seasons – were given in Tables 1-3., where R PA/PB =R PA /R PB.Table 1Summer, β B= 47.5˚β A [°] R PA/ PB [%] Deviation24 141 7,2347.5 100 2,5971 86 2,46Table 2β A [°] R PA/ PB [%] Deviation24 80 1,5547.5 100 1,8371 81 3,37Autumn, β B= 47.5˚Table 3Winter, β B= 47.5˚Figure 20Winter 47.5˚/71˚β A [°] R PA/ PB [%] Deviation24 80 5,5447.5 102 4,1271 110 5,4927